
导入带有图片的IsoCyte数据 |

|

|

|
|
|
导入带有图片的IsoCyte数据 |
|
|

|
导入带有图片的IsoCyte数据
|
导入带有图片的IsoCyte数据 |
|
|
|
|
|
导入带有图片的IsoCyte数据 |
|
|
|
|
|
||
在IsoCyte中调整了导出设置后, 用户便可以把数据导入到FCS Express第4版中。
在本节中用到的IsoCyte文件可以在教程样本数据库中找到。
| 1. | 请选择Application Button(应用程序按钮)→Edit Preferences(编辑选项)→Data Loading(数据导入)→IsoCyte Options(IsoCyte选项)。 |
| 2. | 请点击Load cell images(导入细胞图片)复选框。 |
| 3. | 请点击Load as Plate(作为细胞板导入)复选框。 |
| 4. | 请点击OK。 |
Data Loading(数据导入)选项中的IsoCyte options(IsoCyte选项)页面看起来应该如图T25.2所示。
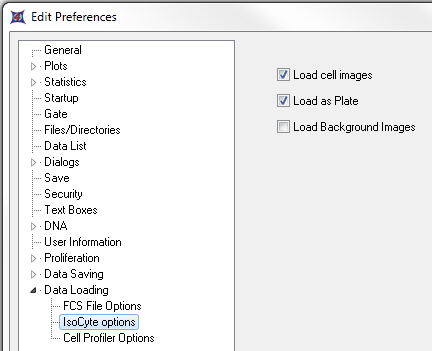
图T25.2 Setting up IsoCyte Data Loading Preferences in FCS Express (在FCS Express中设置IsoCyte数据导入选项)
| 5. | 请选择Insert(插入)→Other Plots(其它绘图)→Heat Map(热图)命令(图T25.3)。 |
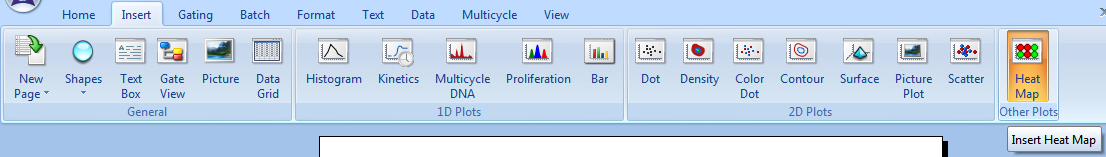
图T25.3 插入热图
| 6. | 请点击版面。 |
| 7. | 请从Select a Data File(选择数据文件)对话框中的files of type:(文件类型:)下拉列表中选择Isocyte files(Isoctye文件)(*.iso)(图T25.4)。 |
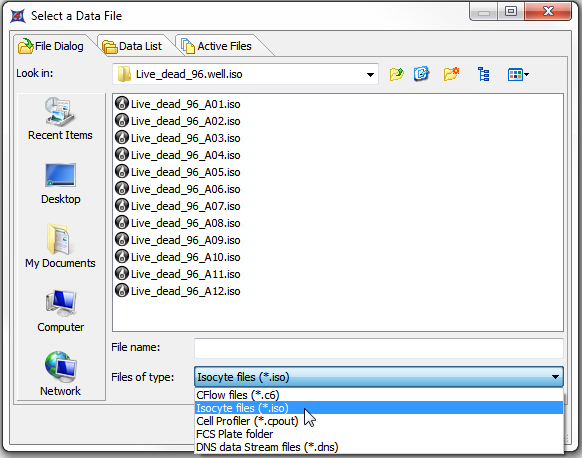
图T25.4 Choosing an IsoCyte file for a Heat Map (为热图选择IsoCyte文件)
| 8. | 请来到Sample Data(样本数据)→Isocyte With Images(带有图片的Isocyte)→Live_dead_96.well.iso文件夹。 |
| 9. | 请选中列表中的Live_dead_96_A01.iso文件。 |
| 10. | 请点击Open(打开)。 |
这时会出现一个显示你的数据的热图,表明数据被成功导入(图T25.5)。 我们在本节中使用的数据集仅仅包括一行样本。
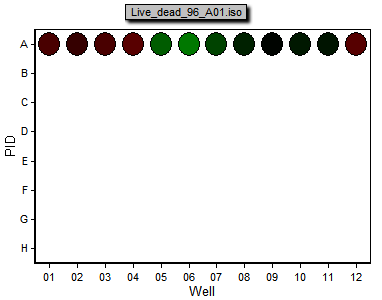
图T25.5 A Heat Map Generated from IsoCyte Data (从IsoCyte数据生成的热图)
要想查看和每个细胞孔对应的图片
| 11. | 请通过选择Insert(插入)→2D Plots(二维绘图)→Picture Plot(图像绘图)来插入一个Picture Plot(图像绘图)(图T25.6)。 |
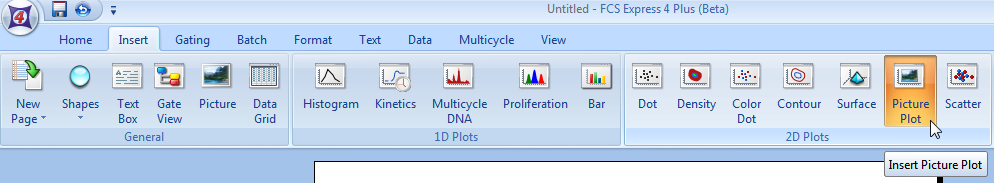
图T25.6 Insert a Picture Plot (插入图片绘图)
| 12. | 请点击版面。 |
这时在版面上会出现一个图像绘图(图T25.7)。 图像绘图把整个细胞板上的图片作为一个叠加图层显示出来。 我们现在要创建一个细胞孔门,把它应用在图像绘图上,以便显示仅仅和这个细胞孔相关的图片。
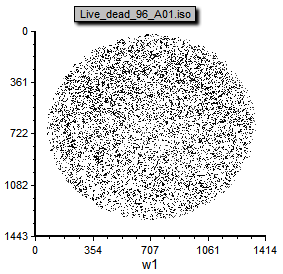
图 T25.7 A Picture Plot with All Images/Cells from All Wells on the Same Plot (一个图片绘图把所有细胞孔中的图片/细胞显示在同一绘图上)
| 13. | 请为Heat Map(热图)中的A6细胞孔创建一个细胞孔门(图T25.8)。 |
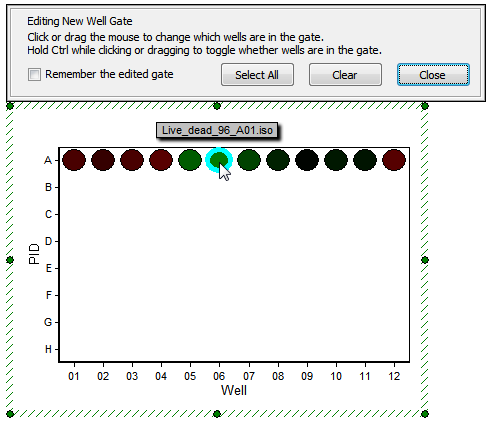
图T25.8 Gating a Heat Map (在热图上进行门操作)
| 14. | 请把上一步中的Well Gate(细胞孔门)应用到Picture Plot(图像绘图)上(图T25.9)。 要想更多地了解如何应用门,请参见门操作教程。 |
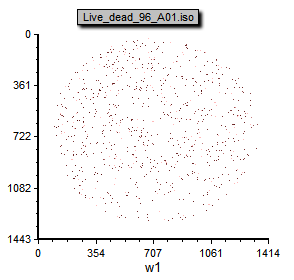
图T25.9 Picture Plot with Well Gate Applied (应用了门操作的图片绘图)
现在Picture Plot(图像绘图)中显示的图片就是根据细胞孔门所定义的。 对Well Gate(细胞孔门)进行编辑或者选择不同的细胞孔将改变Picture Plot(图像绘图)中显示的图像。
在下一节中,我们将对IsoCyte进行设置,以便以数值格式导出实验(仅含数据)。