数据导航器功能
如图T12.6所示,Data Navigator(数据导航器)是按照版面中的数据文件来组织的。每个数据文件名称下,是使用该数据文件的绘图列表。现在我们将探讨Layout Navigator(版面导航器)的众多功能。
| 1. | 请把光标移到9 - Density ? TCellSample3.fcs compensated (APC-Cy7-A vs PE-Cy7-A)上,位置在Data Navigator(数据导航器)中的TCellSample3.fcs数据文件列表下,如图T12.7中的光标所示。 |
这时会出现该二维绘图的一个缩略图,如图T12.7所示。这可快捷提醒您哪一个绘图是和这个数据文件相关联的,特别当绘图不可见时。这个方法适用于在Data Navigator(数据导航器)中列出的所有绘图。
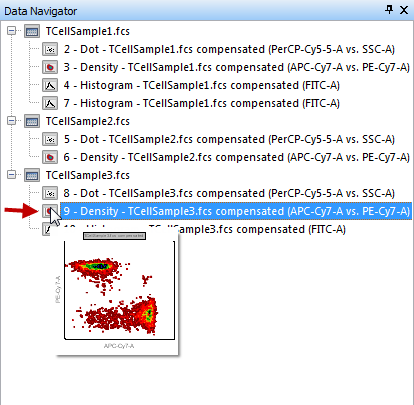
Figure T12.7 Thumbnail Image of a 2D Plot on the Data Navigator
我们将使用Data Navigator(数据导航器)来修改显示在二维绘图上的数据。我们将用Data Navigator(数据导航器)中的TCellSample2.fcs数据来替代版面右下角的一维绘图中的TCellSample2.fcs数据。
| 2. | 请把光标放到Data Navigator(数据导航器)中的TCellSample2.fcs数据文件上,让其高亮显示为蓝色,如图T12.8所示。 |
| 3. | 按下鼠标左键不放。 |
| 4. | 拖拽TCellSample2.fcs数据文件到7 -Histogram -TCellSample1.fcs compensated (FITC-A)绘图上,如图T12.12中的光标和蓝色高亮所示。 |
| 5. | 当TCellSample2.fcs数据文件在7 -Histogram -TCellSample1.fcs compensated (FITC-A)绘图顶端时,松开鼠标。 |
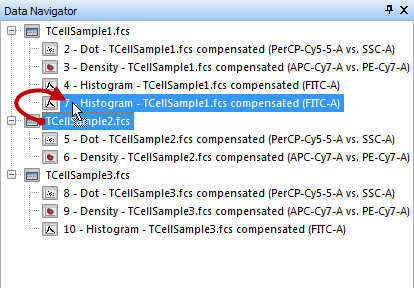
Figure T12.8 Dragging TCellSample2.fcs data file onto a 1D plot in the Data Navigator
此时,Select Drag and Drop Action (选择拖放操作)对话框将出现,如图T12.9所示。
| 6. | 选择replace the existing overlays in the plot(替换绘图中已有的叠加图层)(图T12.9)。 |
| 7. | 点击OK。 |
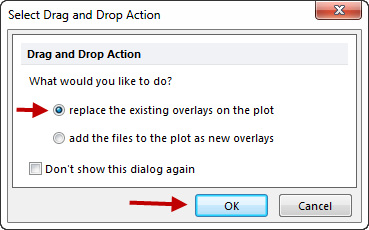
Figure T12.9 Select Drag and Drop Action Dialog
这时,版面中右下方的一维绘图处于选中状态(图T12.10中的绿色边框),并已更新为TCellSample2.fcs数据,边框显示为绿色,如图T12.10所示。
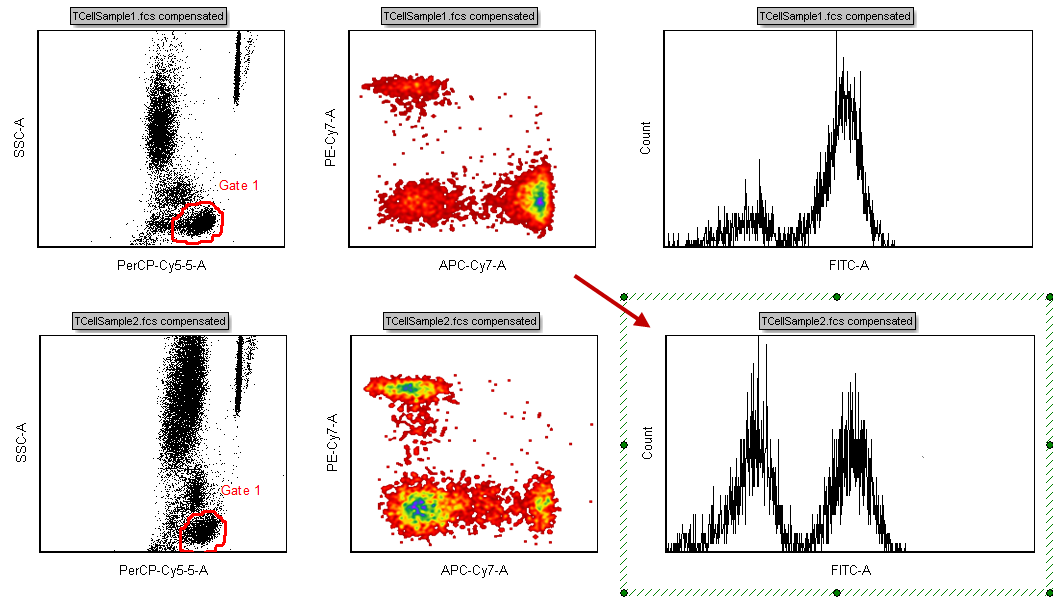
Figure T12.10 Selected and Updated 1D Histogram with TCellSample2.fcs Data
同样,Data Navigator(数据导航器)也进行了更新来反映所做的改动,如图T12.11所示。绘图7 -Histogram -TCellSample2.fcs compensated (FITC-A)显示在TCellSample2.fcs数据文件的下方,如图T12.11中的光标和缩略图所示。
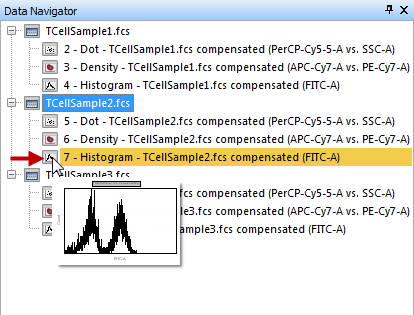
Figure T12.11 Data Navigator Updated to Reflect TCellSample2 Plot Changes
我们现在将在Data Navigator(数据导航器)中使用拖放操作,来在一个柱状图中添加叠加图层。
| 8. | 请把光标放到Data Navigator(数据导航器)中的TCellSample2.fcs数据文件上,让其高亮显示为蓝色,如图T12.12所示。 |
| 9. | 按下鼠标左键不放。 |
| 10. | 拖拽TCellSample2.fcs数据文件到柱状图4 -Histogram -TCellSample1.fcs compensated (FITC-A)绘图列表上, |
| 11. | 当TCellSample2.fcs据文件在柱状图列项上时,松开鼠标。 |
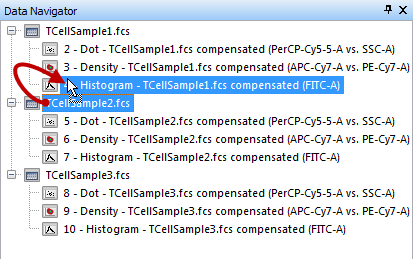
Figure T12.12 Dragging TCellSample2 onto a Histogram Plot in the Data Navigator
此时,Select Drag and Drop Action (选择拖放操作)对话框将出现,如图T12.9所示。但这次,我们将更改我们的选项,从而允许在柱状图上叠加数据。
| 12. | 选择“add the files to the plot as new overlays(把文件作为新的叠加图层添加到绘图中)”。 |
| 13. | 点击OK。 |
这时在版面右上方的柱状图也进行了更新,来显示TCellSample2.fcs数据对应的叠加图层。该柱状图显示于图T12.13中的绿色边框中,新的叠加图层数据显示为红色。
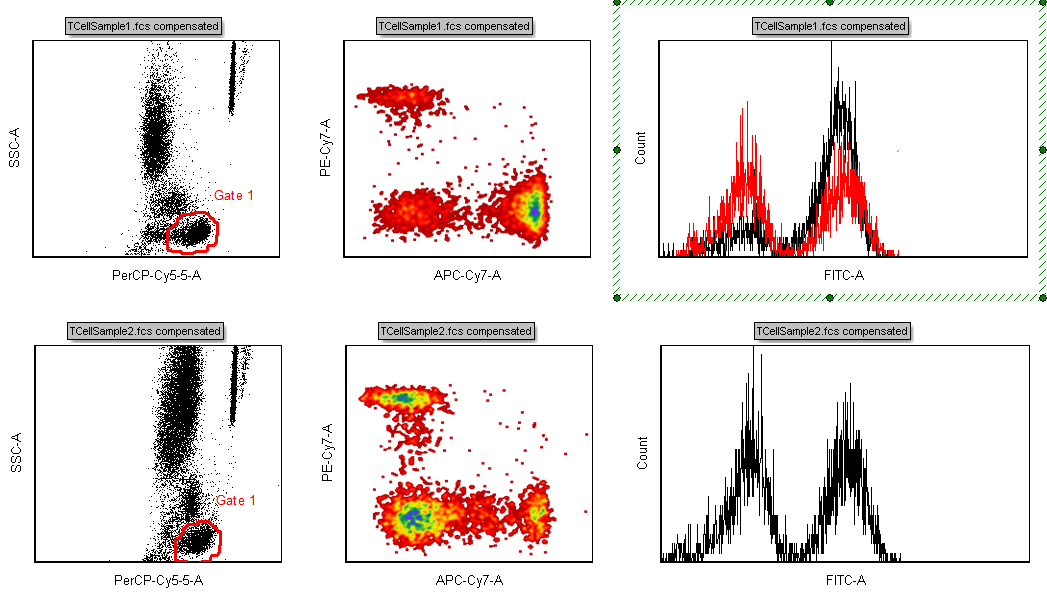
Figure T12.13 Histogram Updated to Show the Overlay of TCellSample2 Data
现在,Data Navigator(数据导航器)再次进行了更新,来显示这些修改,如图T12.14所示。在TCellSample2.fcs的数据文件列表中,一个关于4 -Histogram -TCellSample1.fcs compensated (FITC-A)文件的列将出现,如图T12.14中的光标和缩略图所示。此时,Overlay 2(第二个叠加图层)会出现在柱状图的子文件列表中,来表明TCellSample2.fcs数据文件是TCellSample1.fcs柱状图的第二个叠加图层。注意:在TCellSample1.fcs数据文件列下,柱状图4 -Histogram -TCellSample1.fcs compensated (FITC-A)列表也被更新,来显示Overlay 1(第1个叠加图层),表明数据文件ApoMono.001是底层数据。
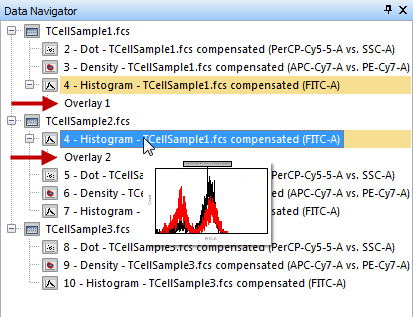
Figure T12.14 Updated Data Navigator with Overlay of TCellSample2 Data
所有之前介绍的在Data Navigator(数据导航器)中进行的拖放数据的操作,也可以使用Data Navigator(数据导航器)的弹出窗口完成。我们现在将使用Data Navigator(数据导航器)的弹出窗口来为版面中右上方的柱状图再添加一个叠加图层。
| 14. | 将光标放在Data Navigator(数据导航器)中的TCellSample3.fcs数据文件上,如图T12.15中的蓝色高亮文件所示。 |
| 15. | 请右键点击,调出相关的弹出菜单。 |
| 16. | 从弹出菜单中选择Copy (复制),如图T12.15中的光标所示。 |
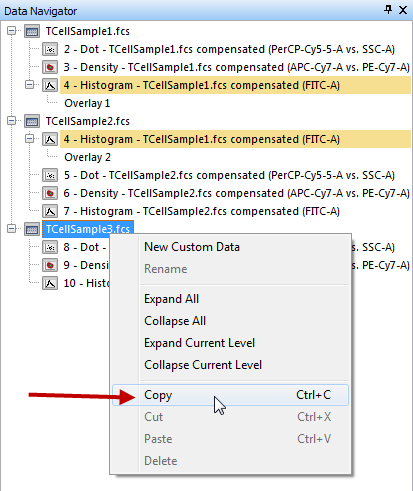
Figure T12.15 Copy Using Data Navigator Pop-up Menu
| 17. | 请将光标放在Data Navigator(数据导航器)中的TCellSample1.fcs数据下的4-Histogram-TCellSample1.fcs compensated (FITC-A)列上,如图T12.16中的蓝色高亮显示。 |
| 18. | 请右键点击,调出相关的弹出菜单。 |
| 19. | 选择Paste(粘贴),如图T12.16中的光标所示。 |
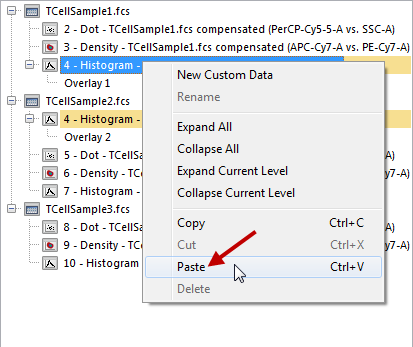
Figure T12.16 Paste Using Data Navigator Pop-up Menu
此时,Select Drag and Drop Action (选择拖放操作)对话框将出现,如图T12.9所示。但这次我们将修改对话框中的选项,允许在柱状图上叠加数据。
| 20. | 选择“add the files to the plot as new overlays(把文件作为新的叠加图层添加到绘图中)”。 |
| 21. | 点击OK。 |
这时,在版面右上方的柱状图也进行了更新,来显示ApoMono.003数据对应的叠加图层。柱状图显示在绿色边框中,新的叠加图层数据显示为蓝色,如图T12.17所示。
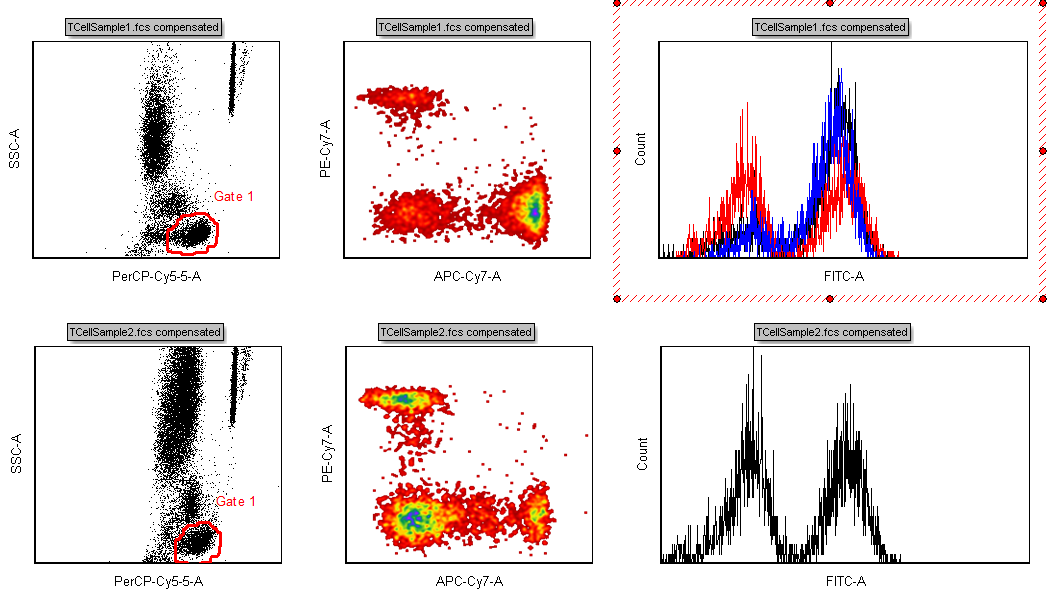
Figure T12.17 Histogram Updated to Show the Overlay of TCellSample3 Data
现在,Data Navigator(数据导航器)也会再次更新,来反映这些修改,如图T12.18所示。在TCellSample3.fcs的数据文件列表中,一个关于4-Histogram-TCellSample1.fcs compensated (FITC-A)的列表将出现,如图T12.18中的光标和缩略图所示。此时,Overlay 3(第三个叠加图层)会出现在柱状图的子文件列表中,来表明TCellSample3.fcs数据文件是柱状图TCellSample1.fcs的第三个叠加图层。
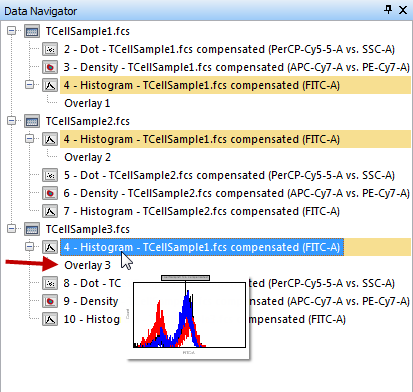
Figure T12.18 Updated Data Navigator with Overlay of TCellSample3 Data
我们可以从Data Navigator(数据导航器)中拖拽数据,来替换绘图上的数据或把数据叠放到绘图上。
我们现在将从Data Navigator(数据导航器)中把一个数据文件拖放到版面中的一个绘图上。在版面中,点状图SSC-A vs.PerCP Cy5.5-A,在页面1的左下角,使用的是TCellSample2.fcs数据。我们将用TCellSample1.fcs数据覆盖到其上。
| 22. | 请把光标放到Data Navigator(数据导航器)中TCellSample1.fcs数据文件上,让其高亮显示为蓝色,如图T12.19所示。 |
| 23. | 按下鼠标左键不放。 |
| 24. | 将数据文件TCellSample1.fcs拖拽到版面中。 |
| 25. | 当TCellSample1.fcs数据文件位于页面1左下角的SSC-A vs.PerCP Cy5.5-A绘图上时,此时光标和绘图边框显示为蓝色,松开鼠标左键,如图T12.19所示。 |
| 26. | 在Select Drag and Drop Action(选择拖放操作)窗口,选择add the files to the plot as new overlays(把文件作为新的叠加图层添加到绘图中)。 |
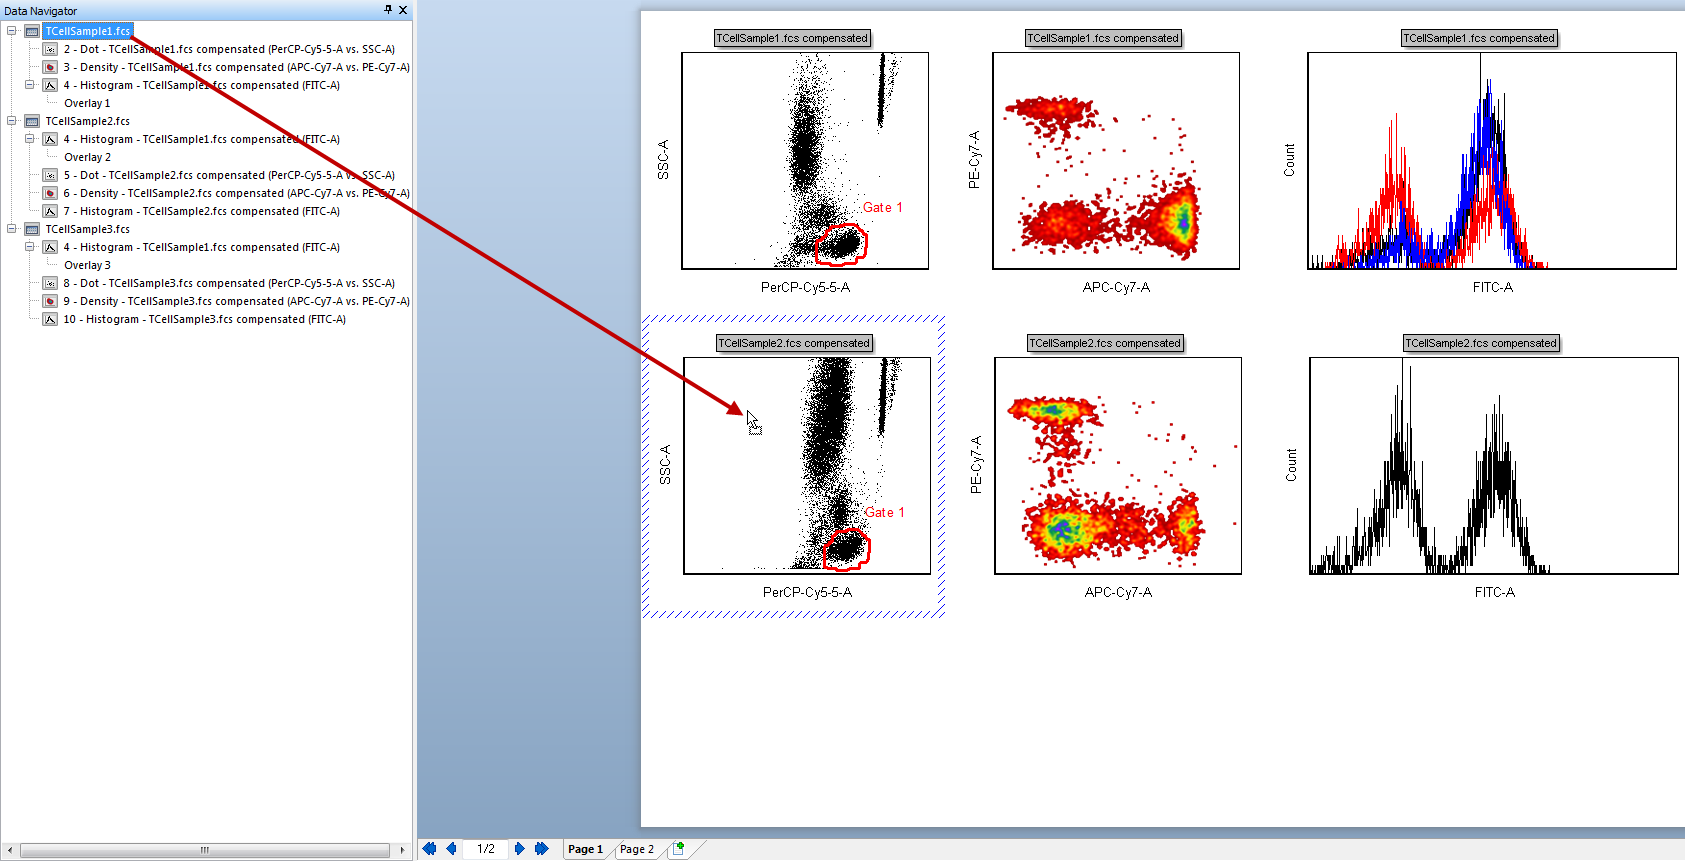
Figure T12.19 Dragging and Dropping TCellSample1 from the Data Navigator onto the Dot Plot on the Layout
此时,版面左下角的两个点状图和Data Navigator(数据导航器)都做了更新,来反映数据的更改,如图T12.20所示。图T12.20中的光标和缩略图显示了Data Navigator(数据导航器)中的变化。

Figure T12.20 Updated Layout and Data Navigator with TCellSample1 Overlay
除了从Data Navigator(数据导航器)中拖拽数据文件到版面中的绘图上之外,我们也可使用Data Navigator(数据导航器)的弹出菜单来复制数据对象,然后利用版面的弹出菜单来将数据粘贴到点状图中。和其他弹出菜单一样,Data Navigator(数据导航器)的弹出菜单也是通过右键点击调出的,只需将光标放置在Data Navigator(数据导航器)中的一个对象上,点击右键即可。我们现在将使用Data Navigator(数据导航器)弹出菜单来在版面中插入一个新的数据绘图。
| 26. | 将光标放在Data Navigator(数据导航器)中的TCellSample3.fcs数据文件上。 |
| 27. | 请右键点击,调出相关的弹出菜单。 |
| 28. | 从弹出菜单中选择Copy (复制),如前图T12.15所示。 |
| 29. | 在版面的底部点击Page 2(第2页)),如图T12.21所示。 |

Figure T12.21 Selecting Page 2
这时会出现版面中的第2页,如图T12.22所示。
| 30. | 请把光标放在版面中一个空白区。 |
| 31. | 请右键点击,调出相应的弹出菜单,如图T12.22所示。 |
| 32. | 从弹出菜单中选择Paste(粘贴)选项。 |
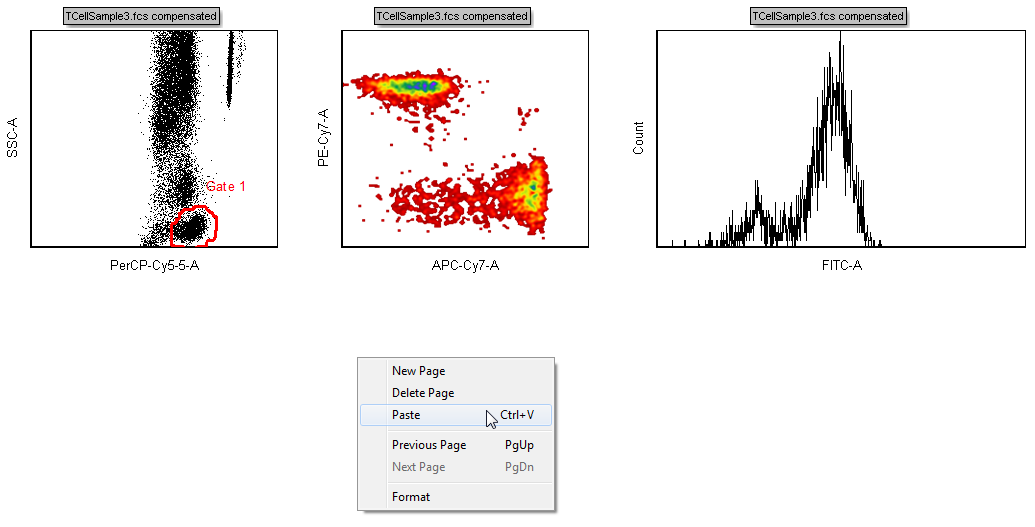
Figure T12.22 Page 2 of the Layout with the Pop-up Menu
此时,Select Plot Types... (选择绘图类型...)对话框将出现,如图T12.23所示。
| 33. | 请选择Density(密度图)作为要打开的绘图类型(图T12.23)。 |
| 34. | 点击OK。 |
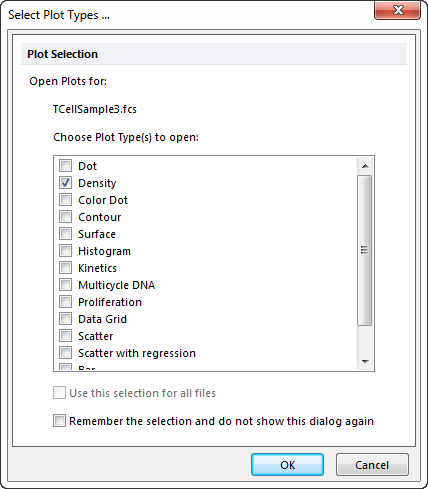
Figure T12.23 Select Plot Types... Dialog
此时,一个针对TCellSample3.fcs数据的密度图就出现了,使用的是默认参数Time vs.FSC-H,如图T12.24所示。可对该绘图按照您的意愿进行格式修改。
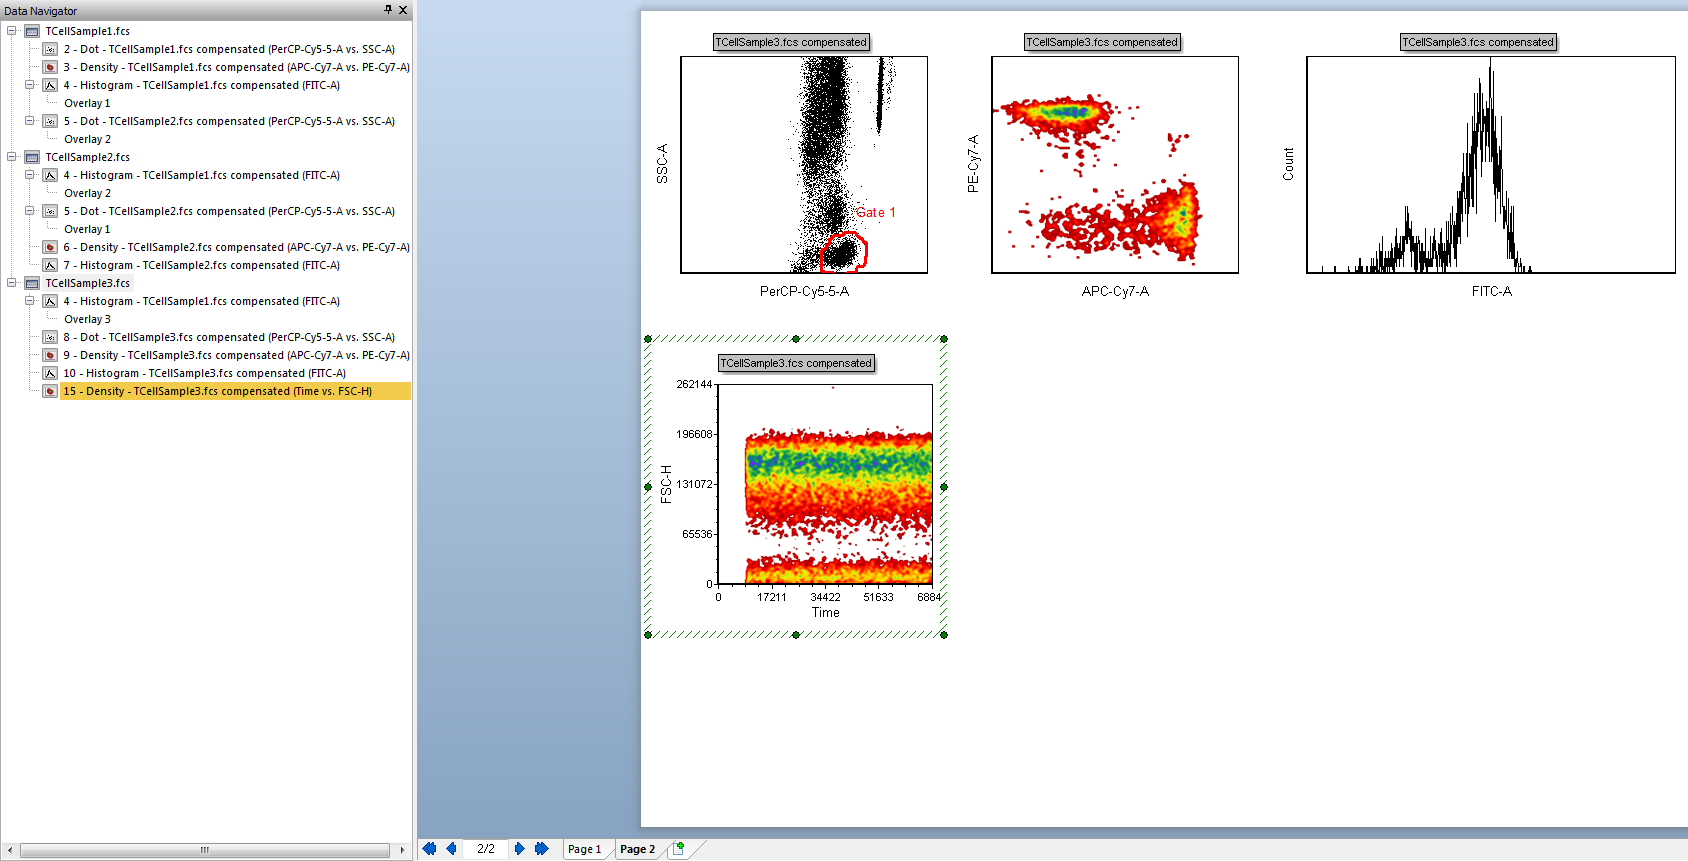
Figure T12.24 Contour Plot of TCellSample3.fcs Data
