使用数据网格来进行分析
FCS Express允许用户为任何绘图插入一个数据网格。数据网格通常以一个一个单元格的形式显示参数数据。在图像细胞分析中,数据网格可以作为一个图像列表来查看单独细胞的图像以及相关参数。
在这一节中,我们将学习如何:
| • | 插入一个数据网格/细胞列表 |
| • | 对数据网格或者细胞列表进行格式化以显示多个细胞的图像和参数。 |
| • | 把门应用到数据网格或细胞列表上 |
| • | 在一个数据网格或者细胞列表上创建门 |
| 1. | 请打开一个新版面。 |
| 2. | 请选择Data(数据)→Organize Data Sets(组织数据集)→Data List(数据列表)命令。此时,Data List(数据列表)窗口将出现(图T9.3)。 |
| 3. | 请点击绿色的加号来添加文件 |
| 4. | 从Files of type:(文件类型:)下拉列表中选择DNS data Stream files (*.dns)(图T18.17)。 |
| 5. | 导航到FCS ExpressTutorial Sample Data archive(教程样本数据库)。 |
| 6. | 请选择pictureplotsample1.dns。 |
| 7. | 点击Open(打开),来将其导入到Data List(数据列表)中。 |
| 8. | 请把pictureplotsample1.dns文件从Data List(数据列表)拖拽到版面上。 |
| 9. | 请选择Color Dot(彩色点状图)、Picture Plots(图像绘图)和Data Grids(数据格),它们位于Select Plot Types... (选择绘图类型...)对话框中(请确保没有其他的复选框被选中)(图T26.1)。 |
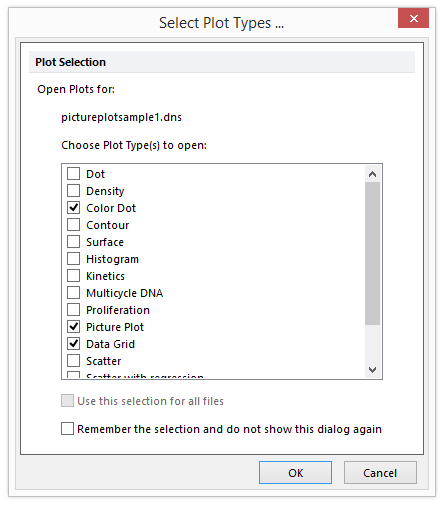
Figure T26.18 Inserting a Data Grid and Two Plots
| 10. | 点击OK。 |
这时在版面上会出现一个图像绘图、数据网格以及彩色点状图。请把这些绘图和网格像图T26.19中那样进行排列。
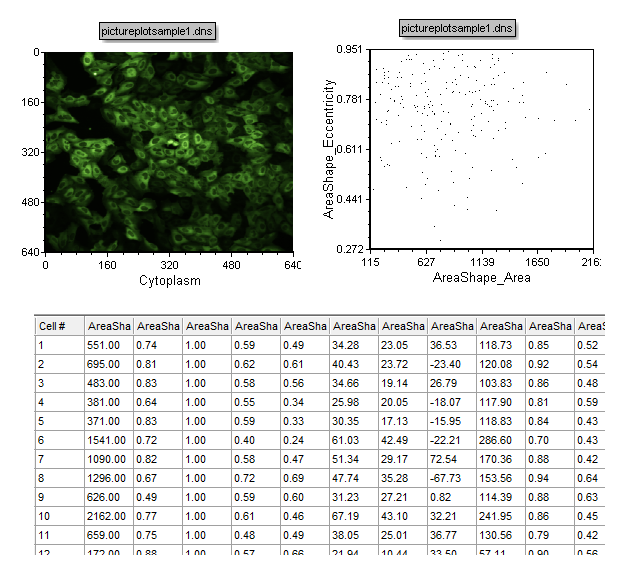
Figure T26.19 A Picture Plot, Data Grid, and Color Dot Plot Arranged on the Layout for Analysis
数据网格可以被用做一个细胞列表,以便查看图像绘图和门中单个的细胞。我们可以对网格进行格式化来显示来自数据的细胞轮廓、一些参数以及门。
| 11. | 请右键点击数据网格。 |
| 12. | 从弹出菜单选择Format(格式)命令。 |
| 13. | 选择Parameters to Display(要显示的参数)类别选项(图T26.20)。 |
| 14. | 点击Only the items check below(仅限在下面选中的项目)单选按钮(图T26.20)。 |
| 15. | 请来到列表底部,点选以下复选框(图T26.20): |
| a. | Intensity_UpperQuartileIntensity_DNA |
| b. | Number_Object_Number |
| c. | Cytoplasm(细胞质) |
| d. | DNA |
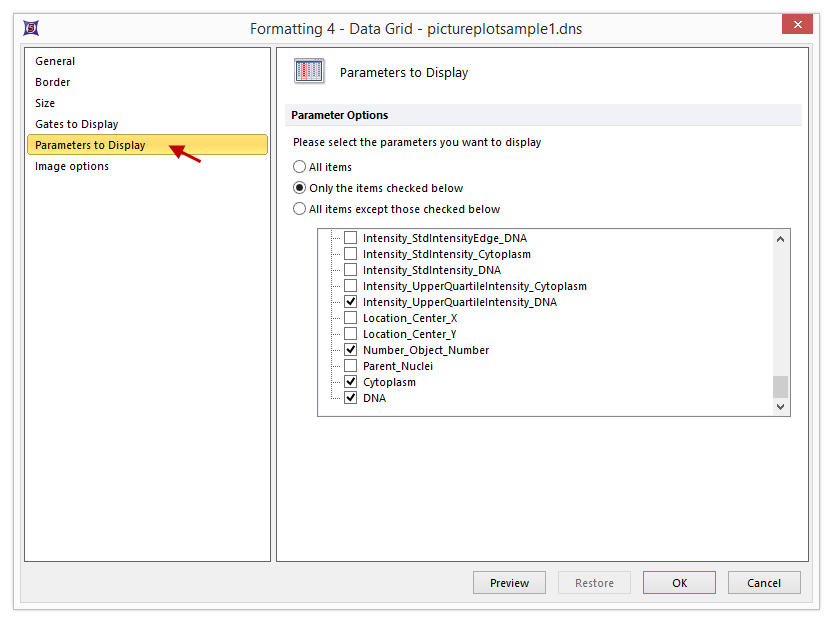
Figure T26.20 Formatting the Parameters to Display for the Data Grid
| 16. | 选择Gates to Display Category。 |
| 17. | 点击All gates(所有门)单选按钮。 |
| 18. | 点击OK。 |
数据网格现在显示所有细胞的参数值、截下来的细胞质图片和DNA图片以及为门准备的一列单元格(图T26.21)。
我们将在点状图以及图像绘图上创建门,然后在数据网格中使用这些门来查看单个事件。
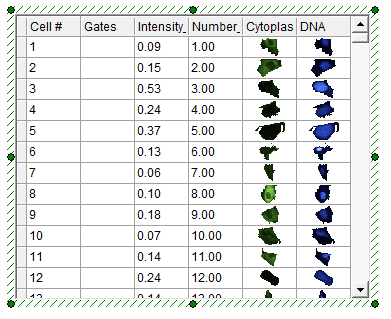
Figure T26.21 Data Grid Displaying the Chosen Parameters, Individual Cell Images, and a Column for Gates
| 19. | 请在图像绘图上创建一个如图T26.22中所示的门,然后将其命名为"Picture Plot Gate(图像绘图门)"。 |
| 20. | 请在点状图上创建一个如图T26.22中所示的门,然后将其命名为"Dot Plot Gate(点状图门)"。 |
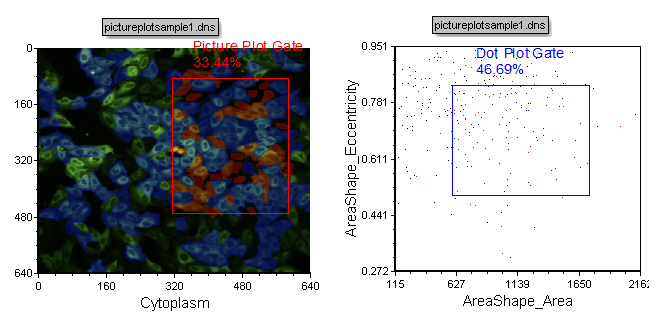
Figure T26.22 Examples of Gates to Create on the Picture and Dot Plots
向下翻动数据网格,请注意,现在门列中显示一些彩色的矩形框(图T26.23)。这些矩形代表了哪些细胞在哪些门中。如果一个细胞在多个门中,那么在"Gates(门)"列里将出现彩色条柱。如果"Gates(门)"列为空,表明该细胞不在任何现在显示的门中。
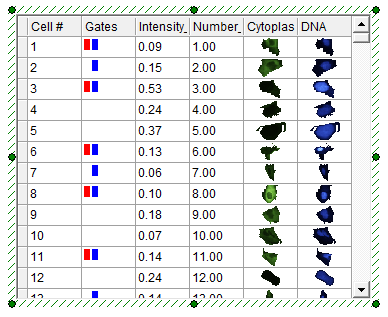
Figure T26.23 Data Grid Displaying Dot Plot and Picture Plot Gates as Colored Rectangular Boxes
接下来,我们将把Picture Plot Gate(图片绘图门)和Current Gate(当前门)应用到数据网格中,以便查看在这些门中单个的细胞。
| 21. | 请点击数据网格,将其选中。 |
| 22. | 导航到Gating(门操作)→Create Gates(创建门)→Current Gate(当前门),然后从Current Gate(当前门)下拉列表中选择Picture Plot Gate(图片绘图门(图T26.24)。或者,您可以直接将Picture Plot Gate(图片绘图门)从图片绘图中拖拽到数据网格中。 |
| 23. | 适当调整Picture Plot Gate(图片绘图门),来选中比现在少一些的细胞,如图T26.24所示。 |
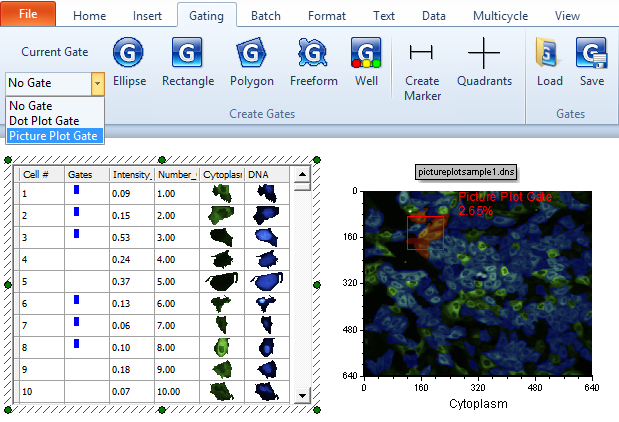
Figure T26.24 Apply Picture Plot Gate to the Data Grid
请注意,现在细胞列表相应地进行了更新,仅仅显示了在Picture Plot Gate(图片绘图门)中选中的细胞。这是一个逐步缩小范围、找到感兴趣的细胞的例子。
| 24. | 请点击数据网格,将其选中。 |
| 25. | 导航到Gating(门操作)→Create Gates(创建门)→Current Gate(当前门),然后从Current Gate(当前门)下拉列表中选择Dot Plot Gate(点状图门)(图T26.25)。或者,您可以在直接将Dot Plot Gate(点状图门)从点状图中拖拽到数据网格中。 |
| 26. | 适当调整Dot Plot Gate(点状图门)的位置,来选中比现在少一些的细胞,如图T26.25所示。 |
请注意,现在细胞列表相应地进行了更新,仅仅显示在图像绘图门中选中的细胞。这是一个逐步缩小范围、找到感兴趣的细胞的例子。
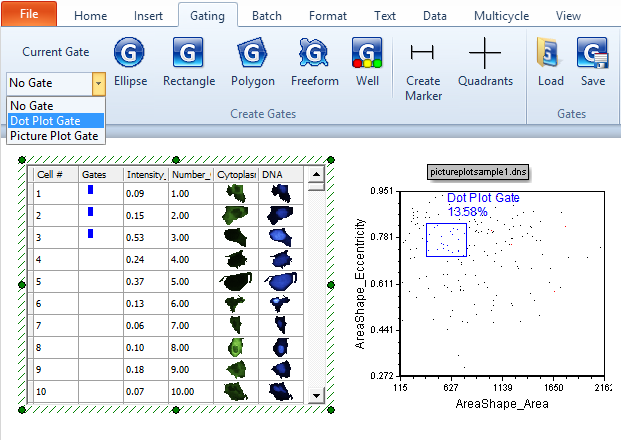
Figure T26.25 Apply Dot Plot Gate to Data Grid
现在,我们要直接在数据网格上创建一个门,来把这些事件显示在点状图和图像绘图上。
| 27. | 请点击数据网格,将其选中。 |
| 28. | 导航到Gating(门操作)→Create Gates(创建门)→Current Gate(当前门),然后从Current Gate(当前门)下拉列表中选择No Gate(没有门)。 |
| 29. | 请右键点击数据网格。 |
| 30. | 从弹出菜单选择Create Gate(创建门)选项。这时会出现一个Range Gate(门范围)选项,如图T26.26所示。 |
| 31. | 点击Range(范围)。 |
| 32. | 从下拉列表中选择Add Range to Gate...(添加范围到门...)。 |
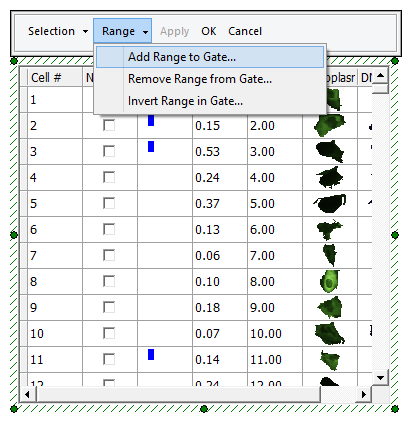
Figure T26.26 Range Gate Selection
| 33. | 请输入范围From(从)1To(到)100,以便选择样本的前100个细胞(图T26.27)。 |
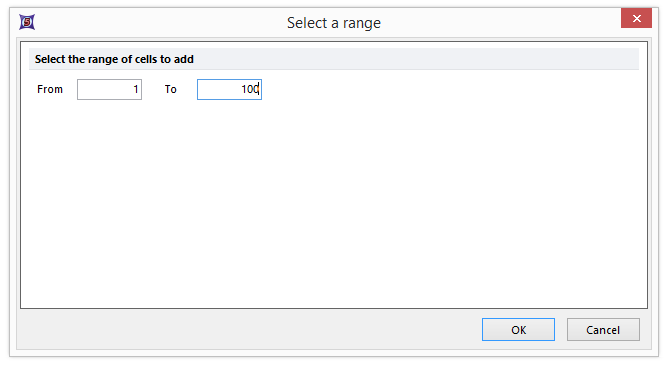
Figure T26.27 Select a Range Dialog
| 34. | 点击OK。 |
| 35. | 在Select a Range(选择一个范围)窗口关闭后,点击数据网格上面、范围门选择区域中的OK(图T26.28)。 |
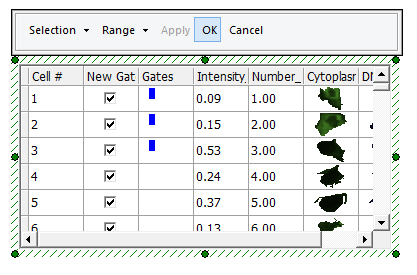
FIgure T26.28 Click OK in the Range Gate Selection area
| 36. | 请把新门命名为range gate(范围门)。 |
| 37. | 点击OK。 |
现在,新的门在数据网格的Gates(门)列中可见(图T26.29)。
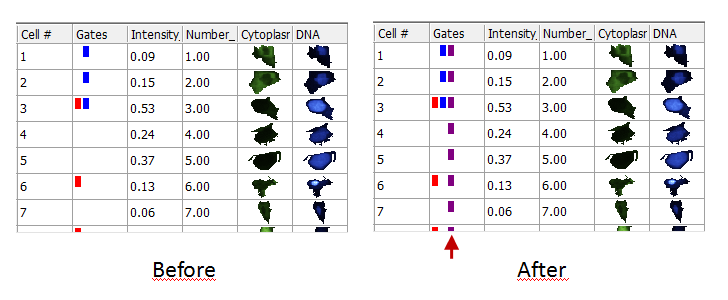
Figure T26.29 - Before and after creating the range gate.
现在,让我们添加更多的事件到range gate(范围门)中。
| 38. | 右键点击数据网格,然后选择Edit Gate(编辑门)→Range Gate(范围门)。 |
| 39. | 点击数据网格上方的范围门选择区域中的Range(范围)。 |
| 40. | 请从下拉列表中选择Add Range to Gate...(添加范围到门...)选项。 |
| 41. | 请输入范围从180到250。 |
| 42. | 点击OK。 |
| 43. | 在范围门选择区域点击OK。 |
请注意,现在range gate(范围门)中包含1-100和180-250范围的细胞。
注意:现在的图像绘图和散点图会用范围门的颜色(本例中为紫色)来显示范围门中的细胞,在本例中是紫色(图T26.30)。
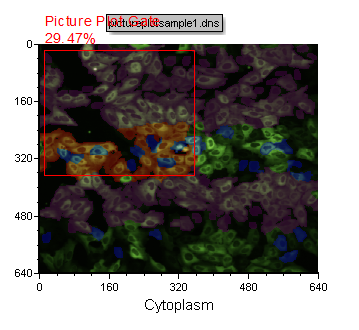
Figure T26.30 Picture Plot Displaying the Eevents in the Range Gate as Purple Highlighted Cells
也可以选择一范围内的单个细胞。
| 44. | 请右键点击数据网格。 |
| 45. | 从弹出菜单选择Create Gate(创建门)选项。 |
| 46. | 请通过在New Gate(新门)一列中选中相应的复选框,来选择5到10的细胞 |
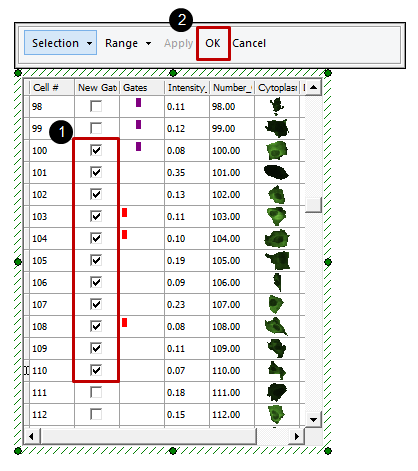
Figure T26.31 Selecting Individual Cells for Gating by Checking the Boxes in the New Gate Column
| 47. | 在范围门选择区域点击 |
| 48. | 请将该门命名为"Selected Cells(选中的细胞)"。 |
| 49. | 点击OK。 |
这时针对这些细胞的一个新的范围门将被创建(图T26.32)。
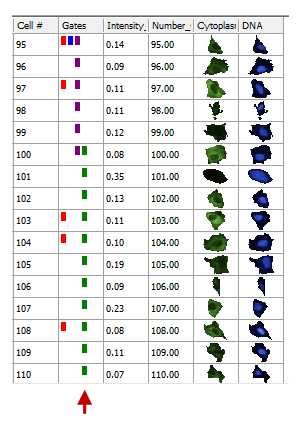
Figure T26.32 Selected Cells Range Gate Displayed as a Green Box in the Gates Column
要在图像绘图以及点状图上查看该门里的细胞,我们需要对两个绘图进行一个快速的设置来更方便地查看一小部分细胞。
| 50. | 右击图像绘图。 |
| 51. | 从弹出菜单选择Format(格式)选项。 |
| 52. | 选择Overlays(数据层)项目。 |
| 53. | 取消对Show Background Image(显示背景图像)复选框的选择。 |
| 54. | 点击OK。 |
| 55. | 请右键点击彩色散点图。 |
| 56. | 从弹出菜单选择Format(格式)选项。 |
| 57. | 选择Overlays(数据层)项目。 |
| 58. | 将Dot Size(点大小)更改到 5。 |
| 59. | 点击OK。 |
现在,我们要把Selected Cells(选中的细胞)门应用到两个绘图上,以便在这两个绘图上仅仅查看这些事件。
| 60. | 请选中点状图和图片绘图。 |
| 61. | 导航到Gating(门操作)→Create Gates(创建门)→Current Gate(当前门),然后从Current Gate(当前门)下拉列表中选择Selected Cells(选中的细胞)。 |
这时的点状图以及图像绘图将仅仅显示手动点选范围复选框所选择的细胞(图T26.33)。另一范围或者单个细胞可以在任何时间被添加进来。
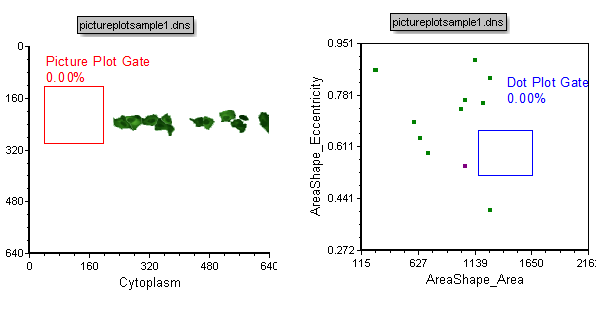
Figure T26.33 Plots Gated on the Range Gate
| 62. | 请右键点击数据网格。 |
| 63. | 从弹出菜单选择Edit Gate(编辑门)→Selected Cells(选中的细胞)命令。 |
| 64. | 点击Range(范围)。 |
| 65. | 从下拉列表中选择Add Range to Gate...(添加范围到门...)。 |
| 66. | 请输入范围从1到50。 |
| 67. | 点击OK。 |
| 68. | 点击范围门选择区域中的Apply(应用)来实时查看对门的修改。 |
| 69. | 点击范围门选择区域中的OK。 |
现在,图像绘图以及点状图将显示新键入和编辑的范围(图T26.34)。同时也注意到因为有事件落到了点状图门中,百分比统计数据也进行了更新。
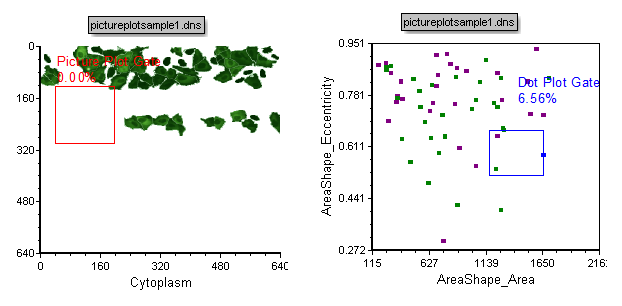
Figure T26.34 Picture Plot and Dot Plot After Adding a New Range to the Selected Cells Gate
