使用参数数学
在考察动力学数据过程中常常要来定义一个比值。这个比值可能是两个染色剂之间的比值,也可能是同一个染色剂在两个不同发射波长上的比值。FCS Express的参数数学功能,可以让用户定义在分析中会用到的从简单比率到复杂公式的各种不同的数学操作。FCS Express将可以计算和显示实际的比值,而非一些其它软件中用到的人为定义的成倍整数。
在这节中,我们将学习如何创建在动力学绘图中使用的参数数学公式。
在本教程学习过程中,用户可以使用自己的数据,也可以使用本教程提供的样本数据。样本数据文件可在Tutorial Sample Data archive(教程样本数据库)中找到。数据文件KineticsTutorial.fey、kinetics10.010和kinetics25.025已经被嵌入,且将在本章节中使用。
| 1. | 请选择File(文件)标签→Open Layout(打开版面)。 |
| 2. | 请从Load Layout(导入版面)对话框中,选择KineticsTutorial.fey版面文件,位于FCS Express Sample Data( FCS Express样本数据)目录下。 |
| 3. | 请选择Data(数据)→Calculate(计算)→Parameter Math(参数数学)→Edit Sequence(编辑序列)(图T21.1)。 |
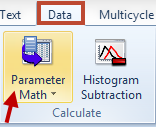
Figure T21.1 Selecting the Parameter Math Sequence Setup Command
| 4. | 在Parameter Math Sequence(参数数学序列)对话框中选择New(新建)(图T21.2)来定义一个新的公式。 |
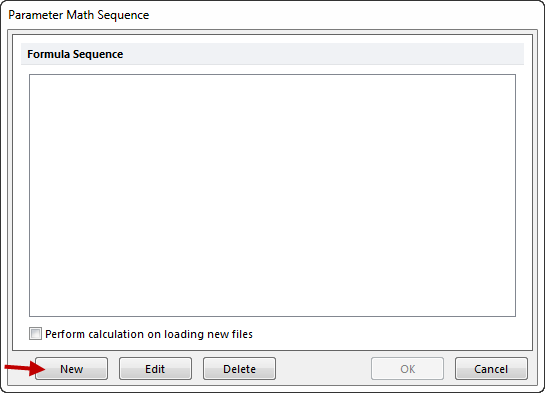
Figure T21.2 Choosing to Define a New Parameter Math Formula
以下步骤均针对图T21.3。
| 5. | 请在Output Parameter Name(输出参数名称)文本框中输入Ca++ Ratio(钙离子比率) |
| 6. | 将First Input Parameter(第一个输入参数)更改为FL1-H |
| 7. | 请更改数学运算符为“/”,来进行除法运算 |
| 8. | 将Second Input Parameter(第二个输入参数)更改为FL3-H |
| 9. | 点击OK |
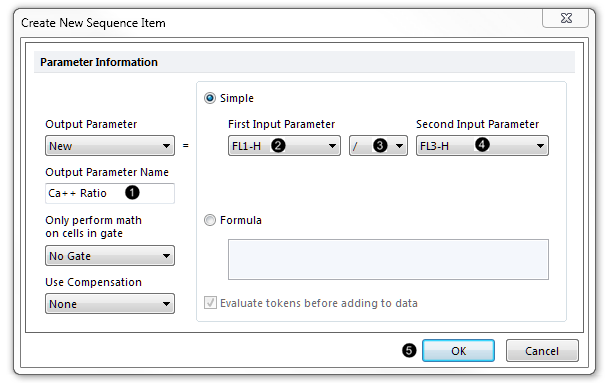
Figure T21.3 Defining a Parameter Math Sequence Item Formula
此时,Parameter Math Sequence(参数数学序列)对话框将显示我们刚才定义的公式序列(图T21.4)。
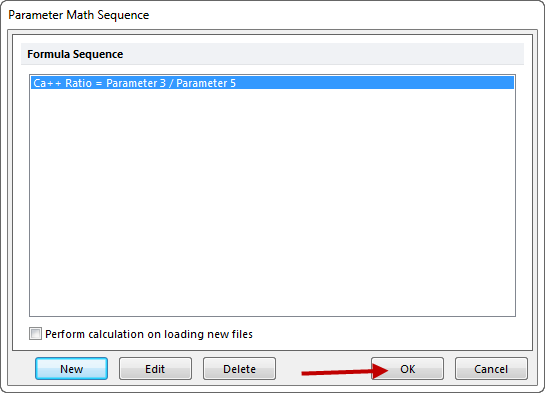
Figure T21.4 Parameter Math Sequence Dialog with Formula Displayed
| 9. | 点击OK。 |
| 10. | 请选择Data(数据)→Calculate(计算)→Parameter Math(参数数学)→Run Sequence(运行序列)→On All Files(应用到所有文件)命令来应用这个公式(图T21.5)。 |
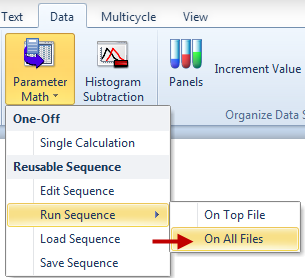
Figure T21.5 Applying the Parameter Math Formula to All Files
| 11. | 请按下CTRL+A键,来选中所有绘图。 |
| 12. | 请选择Format(格式)→Plot Options(绘图选项)→Overlays(叠加图层)命令。 |
| 13. | 请在Y-Parameter(Y-参数)的下拉列表中,选中Ca++ Ratio(钙离子比率)(也就是参数数学定义的公式)(图T21.6)。 |
| 14. | 点击OK。 |
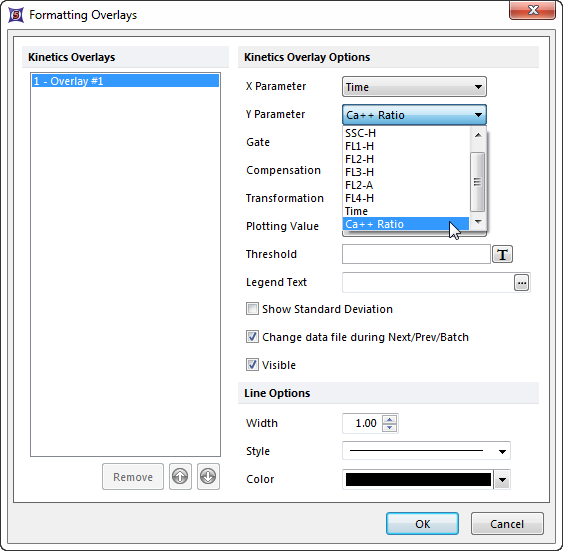
Figure T21.6 Changing the Y Axis to the Ratio Defined by the Parameter Math
版面上的绘图现在应该看起来如图T22.7所示。因为参数数学计算的第一个参数是对数参数,FCS Express会假定新创建的参数也应该是一个对数参数。这是通常情况,但在本例子中并非如此。因为绘图显示实际的比率数值,我们需要通过调整数值设置来在线性坐标系中显示数据。
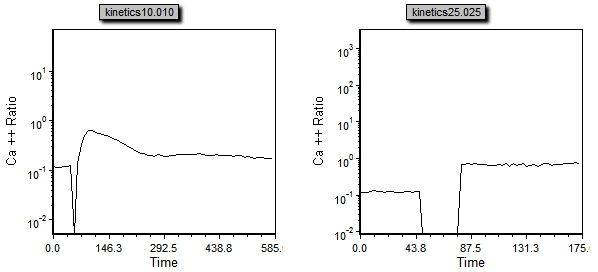
Figure T21.7 Ca++ Ratio vs Time
| 15. | 请按下CTRL+A键,来选中所有绘图。 |
| 16. | 请选择Format(格式)→Plot Options(绘图选项)→Axes(坐标轴)命令。 |
以下步骤均针对图T21.8。
| 17. | 在Select Axis(选择坐标轴)部分,选择Y-Axis(Y轴) |
| 18. | 在Scale(缩放)部分,不要勾选Automatic(自动) |
| 19. | 请把Scale(坐标轴)更改为Linear(线性) |
| 20. | 在Range(范围)部分,不要勾选Automatic(自动) |
| 21. | 针对Minimum(最小值),请输入0 |
| 22. | 针对Maximum(最大值),请输入1 |
| 23. | 点击OK |
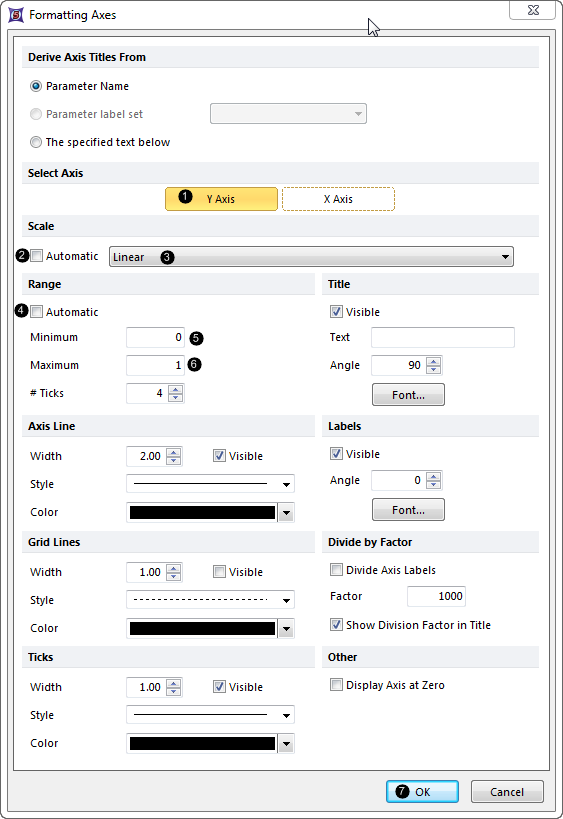
Figure T21.8 Formatting Axes Dialog
这时版面中的绘图应该看起来如图T21.9所示。
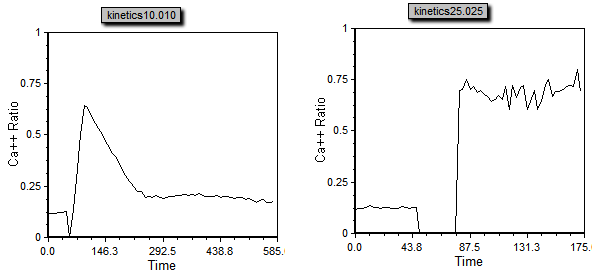
Figure T21.9 Plots Scaled Correctly to Display the Ca++ Ratio
在下一节中,我们将为动力学绘图应用门操作以及进行统计计算。
