使用电子表格分析Data List(数据列表)中的文件
电子表格可以快速的分析比较数据列表中的不同文件的数据,而且无需打开额外的绘图或者创建一个批处理。
在数据文件已经被加载到Data List(数据列表)后,数据列表中的数据文件可以被单一选中或者多个选中并被拖放到电子表格上,电子表格上的单元格中就会展示相关的信息或者统计数据。如果版面中存在绘图,您可以选择从门导出统计信息,并且当调整门时,电子表格中的值将实时更新。
观看下面的短片或查看书面步骤,了解如何使用此功能。
In FCS Express 6 the Spreadsheet feature may be used to quickly analyze and compare statistics for many data files from the data list without opening additional plots or creating a batch process. Watch this short overview to learn about the new feature.
在电子表格中分析数据列表中的文件:
| 2. | 打开Data List(数据列表)。(图1112) |
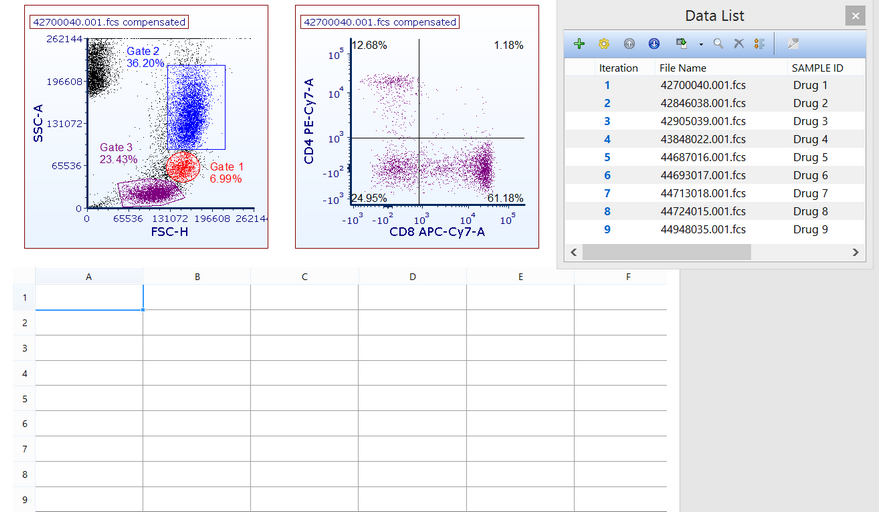
Figure 11.14 - A layout with spreadsheet created and data list opened.
| 3. | 在数据列表中多重选择数据文件。 |
| 4. | 拖放这些数据列表中的数据文件到电子表格中希望统计数据出现的位置,如第一个单元格中(图1113)。 |
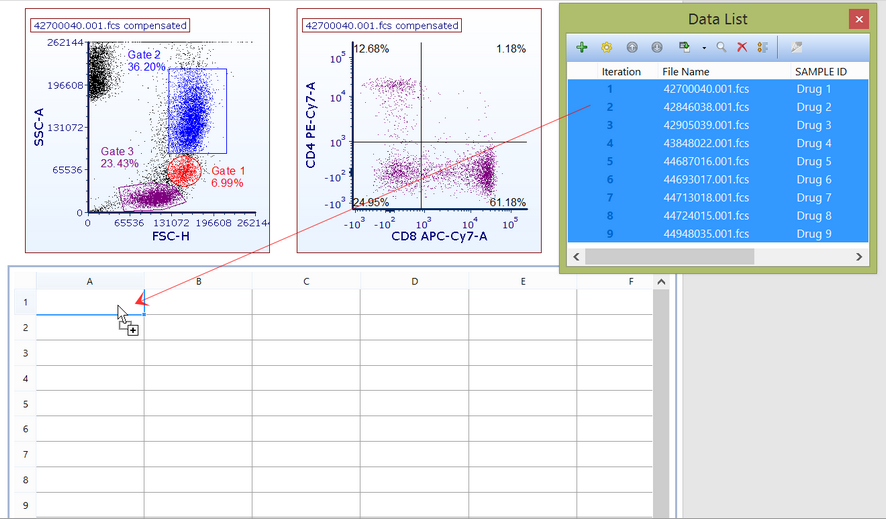
Figure 11.15 - Dragging and dropping data files from the data list into a cell in the spreadsheet.
| 5. | 选择Statistic Token(统计标记)或Keyword Token(关键字标记)这些选项会出现在,Paste Special(特异性粘贴)对话框。在这个例子中,Statistic Token(统计标记)已经被选中。 |
| 6. | 在Edit Statisti(编辑统计)的对话框的parameter(参数)下拉菜单中选择要统计的合适的参数(图11.14)。 |
注意:不管你插入的何种的统计数据,有一个参数必须被选择。
| 7. | 选择一个补偿或者选择None(无选择),这2项会出现在Compensation(补偿)的下拉菜单中。 |
注:通过在补偿的下拉菜单中选择None(无选择),特异于User Options(用户选项)的补偿默认选项将被使用。
| 8. | 如果需要的话,从Select Gate(选择门)的下拉菜单中选择一个门。 |
| 9. | 在statistic list(统计列表)中选择一个或者多个统计(如下图)。 |
| 10. | 点击OK。 |
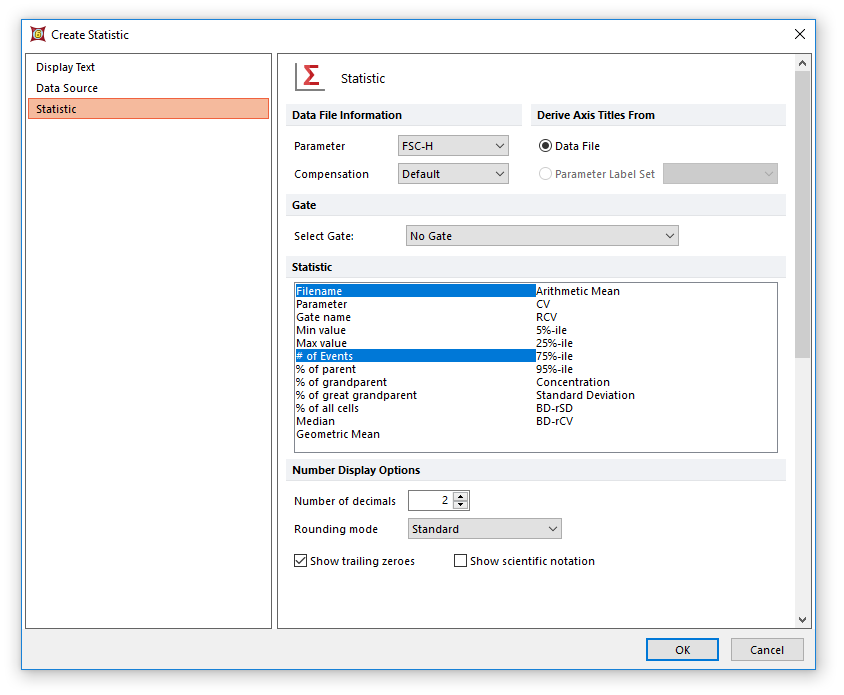
Figure 11.16 - Selecting the parameter, compensation, and statistics to insert in the spreadsheet cells.
那些你从数据列表中选中的数据文件的数据会出现在电子表格中并且会随着门的变化而发生调整(图11)15)。
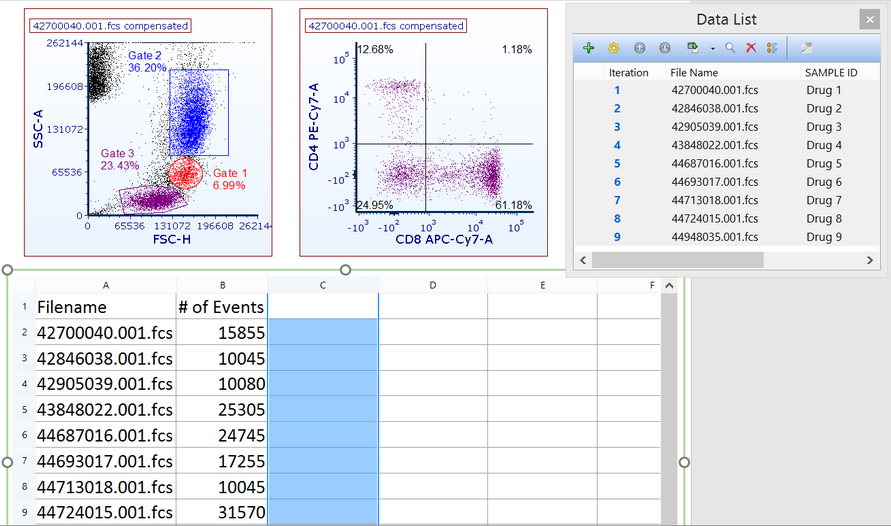
Figure 11.17 - Statistics for all of the data files selected will appear in the spreadsheet.
如果需要其他的统计信息或者不同参数的统计信息,请重复以上步骤。在下面的示例中,添加了门统计信息(Gate 1)和不同参数(Median CD8)的统计信息(图11)16)。
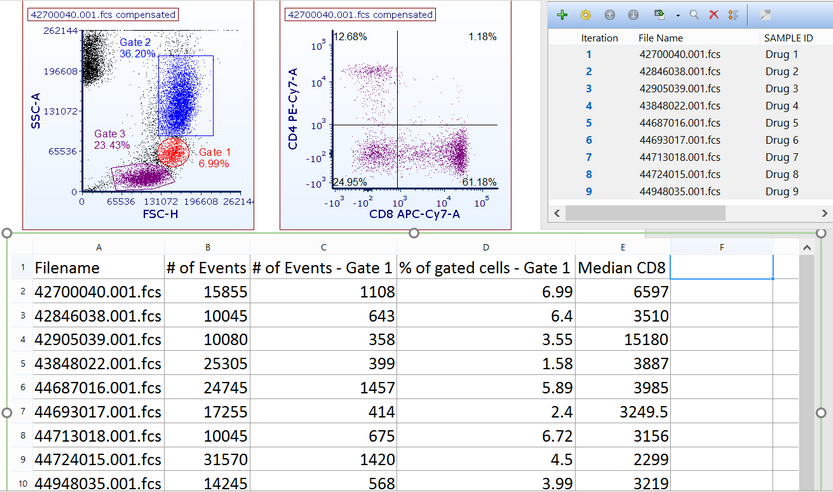
Figure 11.18 - Spreadsheet displaying statistics from 9 data files from different gated populations and parameters. Statistics will update in real time as gates are adjusted.
