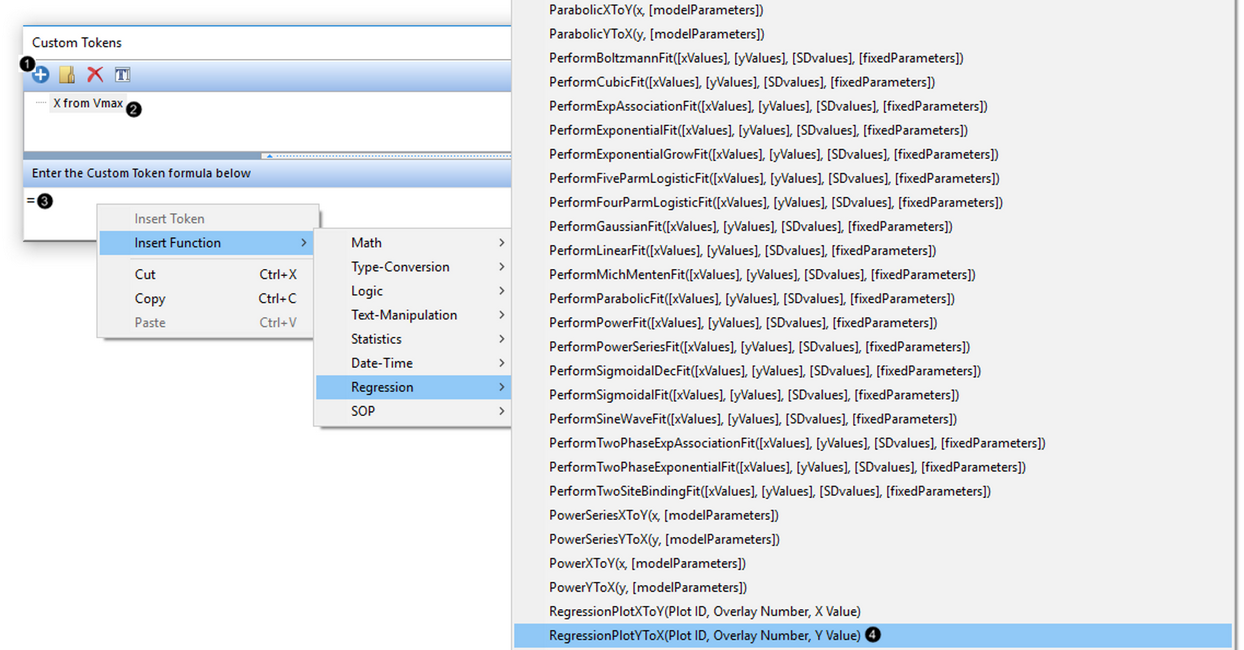
现在,我们将使用“回归图Y到X”自定义功能,在上一节的回归散点图来计算Vmax的X值。
请先确保已完成本教程上一节内容的学习。
| 1. | 选择View(查看)标签→Tokens(符号)→Custom Tokens (自定义符号)命令。 |
| 2. | 点击自定义符号窗口中的蓝色加号,创建一个新的自定义符号(图T17.25, ). ). |
| 3. | 在新的自定义标记中输入“X from Vmax”(图.T17.25, ). ). |
| 4. | 在自定义符号窗口的自定义标记公式窗格中输入等号(“=”)(图.T17.25, ). ). |
| 5. | 右键单击并选择从弹出的菜单中选择插入Function(功能)> Regression (回归)> Regression Plot Y to X(从Y到X的回归曲线(图T17.25, ). ). |

Figure T17.25. Inserting a Custom Token function to interpolate X from Y from the regression
自定义符号公式窗格将出现在(图T17.26.

Figure T17.26. "RegressionPlotYtoX" Interpolation Custom Token formula
现在,我们将替换这个自定义标记的组分,并从布局中获取具体信息。
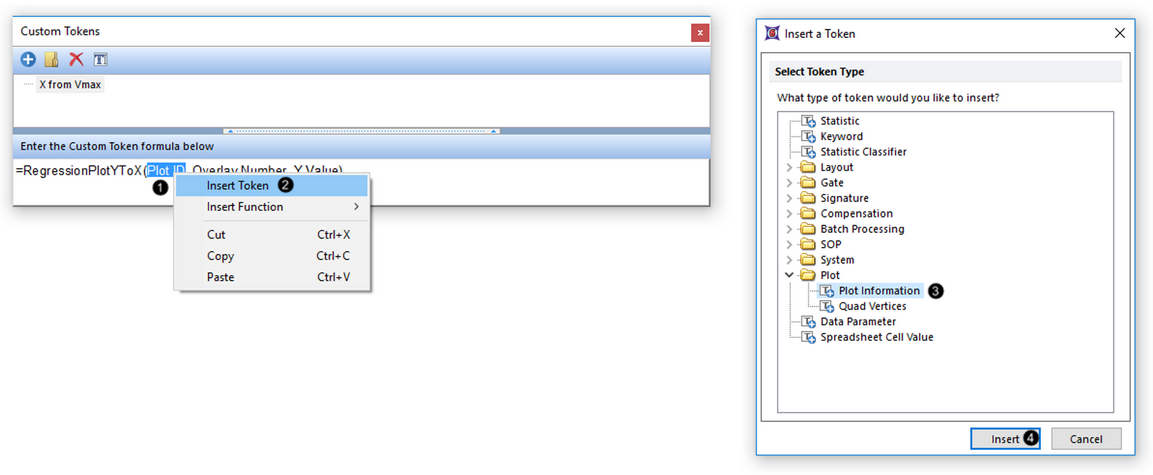
| 6. | 突出自定义标记中的“Plot ID”文本。(图T17.27, ). ). |
| 7. | 右键单击Plot ID,并选择Insert Token(插入标记)(图T17.27, ). ). |
| 8. | 选择Plot Information(绘图信息)从Plot插入标记对话框的节点(图.T17.27, ). ). |
| 9. | 点击Insert(插入)(图T17.27, ). ). |

Figure T17.27. Filling components of the Custom Token
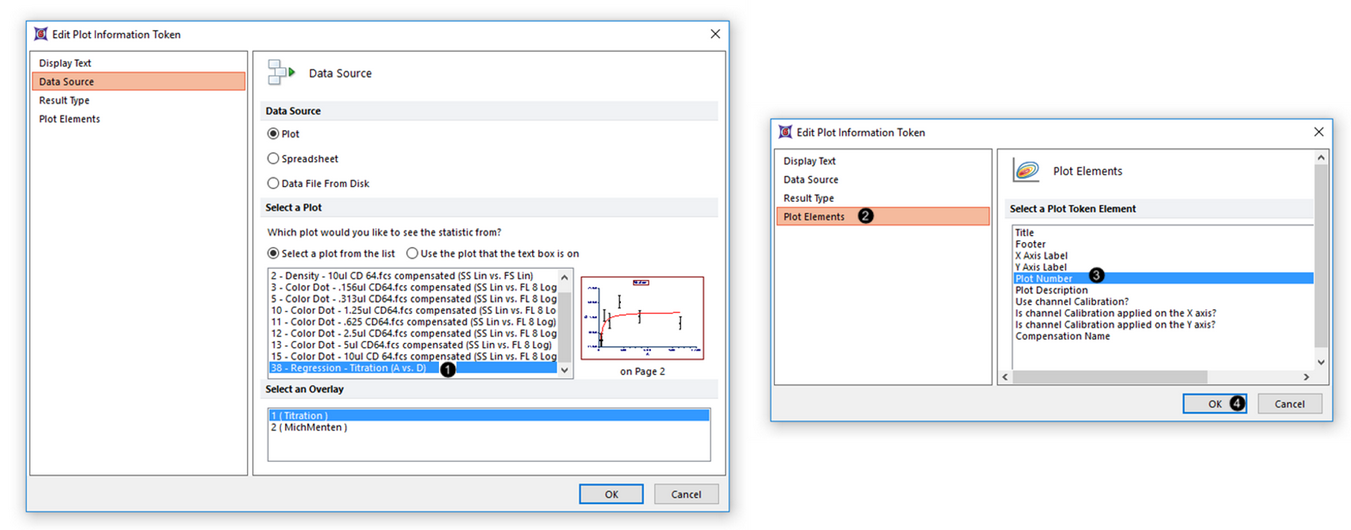
| 10. | 滚动到并选择位于编辑图信息标记对话框处的Select a Plot(选择一个绘图)选项(图.T17.28, ).在选择的正确图像中选择正确的缩略图。 ).在选择的正确图像中选择正确的缩略图。 |
| 11. | 选择Plot Elements(绘图元素)对话框(图.T17.28, ). ). |
| 12. | 选择Plot Number(绘图编号)该选项来自于Plot Token Element box(图像标记元素框)(图.T17.28, ). ). |
| 13. | 点击OK(图T17.28, ). ). |

Figure T17.28. Filling components of the Custom Token, continued
| 14. | 高亮显示自定义标记的“Overlay Number(覆盖数)”文本(图.T17.27, above). |
| 16. | 高亮突出自定义标记的“Y值”文本(图.T17.27, above). |
注意:输入的数值太接近或等于Vmax,因为随着michaelis - menten方程渐近接近Vmax,将导致产生一个无意义且非常高的X值。作为在任意的freetext值中输入的替代方法,您可以创建一个Custom Token(自定义标记),该自定义标记几乎(如90%)等价于Vmax regression token(Vmax回归标记),并在“Y值”文本的位置输入这个自定义标记。
"X from Vmax"自定义标记公式将出现在下面(图.T17.29,左边)).我们将插入这个结果作为自定义标记的布局。
| 18. | 将“X from Vmax”自定义标记从自定义标记窗口面板上拖拽至空白处,或者拖拽至回归曲线图上。 |
自定义标记的数学计算结果将显示在文本框中(图.T17.29,Center(中心)).现在我们将在文本框中添加描述性的自由文本。
| 20. | 在自定义标识前输入“The amount of antibody to use is(使用的抗体量是)”以及“"uL" or "microliters" ”。 |
此时,布局上显示步骤17中接近Vmax Y值所插入的X值(图.T17.29,所示).

Figure T17.29. Inserting the completed Custom Token for interpolated X value onto the layout


