Scatter with regression plots(带回归分析的散点图)
要插入一个带回归分析的散点图plot,
| 1. | 请选择Insert(插入)二维图谱→带回归分析的散点图命令按钮(图1160). |

Fig. 11.62 Inserting a scatter with regression plot.
| 2. | 在图谱上点击(或点击-拖拽)用户希望图谱出现的地方。 |
注意:图谱能从顶端的电子表格显示相关数据例如:如果电子表格最近经常被选中或编辑,那么最上面的电子表格就是最近访问过的。
| 3. | 将X-轴和Y-轴更改为您想要的参数。 |
要改变一带回归分析的散点布图的格式:
| 1. | 请右键绘图。 |
| 2. | 从弹出菜单中选择Format(格式化)来进入plot formatting options(绘图格式化选项). |
| 3. | 选择回归分析 拟合选项。选项。 |
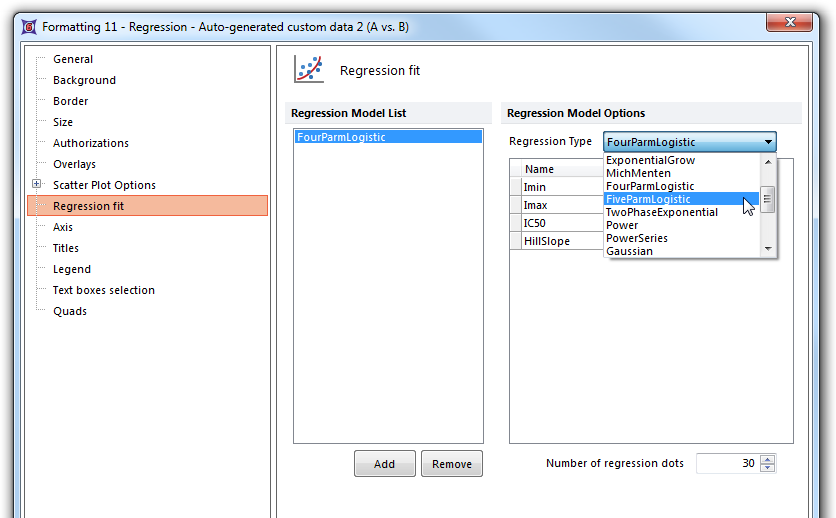
在回归拟合项目类别中,您可以从回归分析 输入(如图 1161从下拉列表中输入可用的回归曲线方程,(图11),来让您的数据达到最佳拟合。

Fig. 11.63 Formatting a scatter with regression plot.
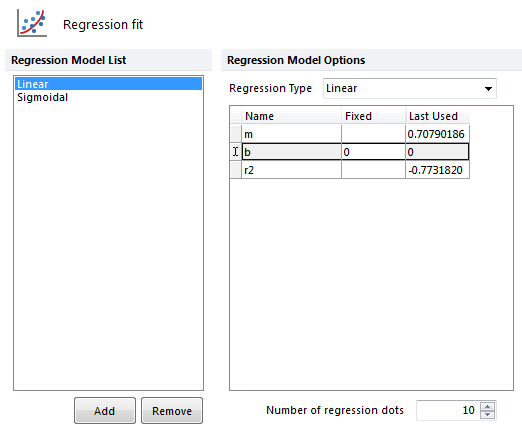
请注意,多重拟合可以使用该方法进行添加或删除多个匹配项在回归分析模式列表中的增加(add)和删除(remove)命令按钮和Remove(删除)Add(添加)Regression Model(回归分析模型) 中。此回归分析 Model(回归分析模型) 选项,可让您查看模型参数及在合适位置输入一固定的参数(图1162).该模型参数将被添加到一个布局中,作为实时更新指令通过Scatter with Regression Tokens(带回归分析的散布图标记)添加到版面上,作为一实时更新的标记.
同样,您也可以增加Number of regression dots(回归数据点的数量)以便曲线看起来更加的平滑,但是大多数的图谱30个点就足够满足条件了

Fig. 11.64 Regression Model Options with a Linear and Sigmoidal fit added to the Regression Model List for comparison. Parameters for the regression model are displayed on the right and a fixed parameter may be typed in the Fixed column. Note in the example that the line was forced through zero by adding a fixed value of "0" to the column.
