在数据网格中查看补偿和转化值
数据网格可以展示补偿和转化值。请注意,在一个绘图或者被选中的数据网格中一次只能展示一个补偿和转化值另外,数据网格中会有一列来展示转化。
| • | 从补偿导航界面拖拉补偿(图18.7)。 |
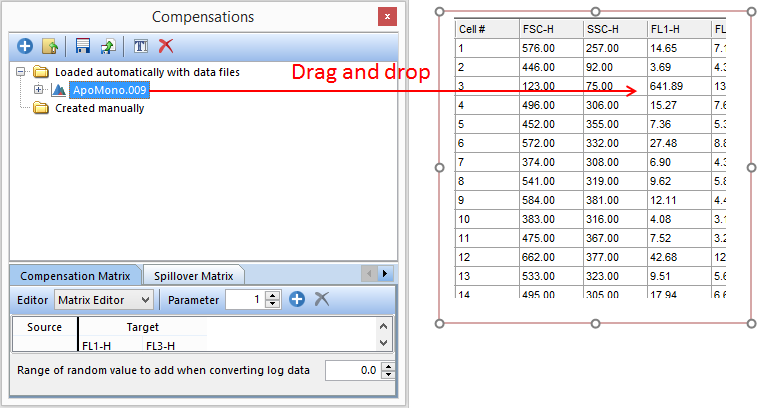
Figure 18.7 - Drag compensation from Compensations navigator and drop onto data grid (red arrow).
| • | 右击Data Grid(数据网格)→Show Compensated Values(显示补偿值)→选择None(无补偿)或者其他列表中的选项(图188)。 |
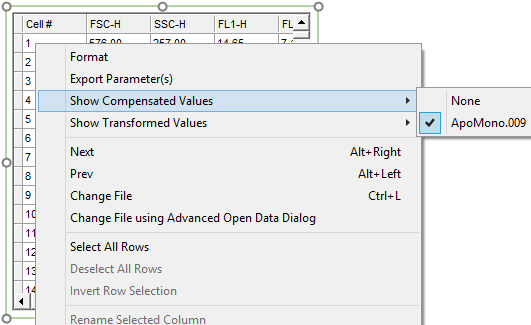
Figure 18.8 - Right-click data grid to Show Compensated Values menu.
| • | 进入 格式对话框→Data Options(数据选项)→在Use Compensation(使用补偿)下拉菜单中选择补偿→OK(图189) |
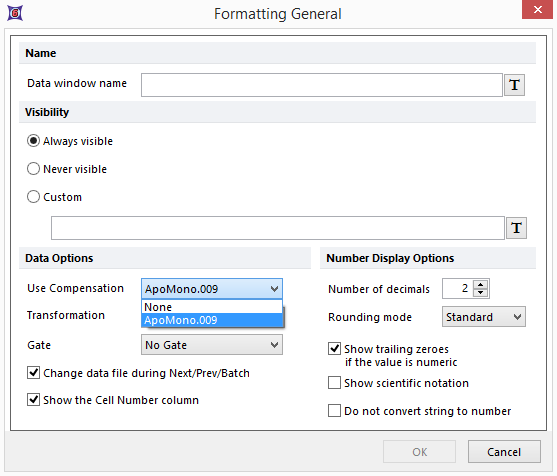
Figure 18.9 - Using Formatting dialog to select from Use Compensation drop down list under Data Options.
| • | 从transformations(转化)导航界面拖拉到数据网格(图1810)。 |
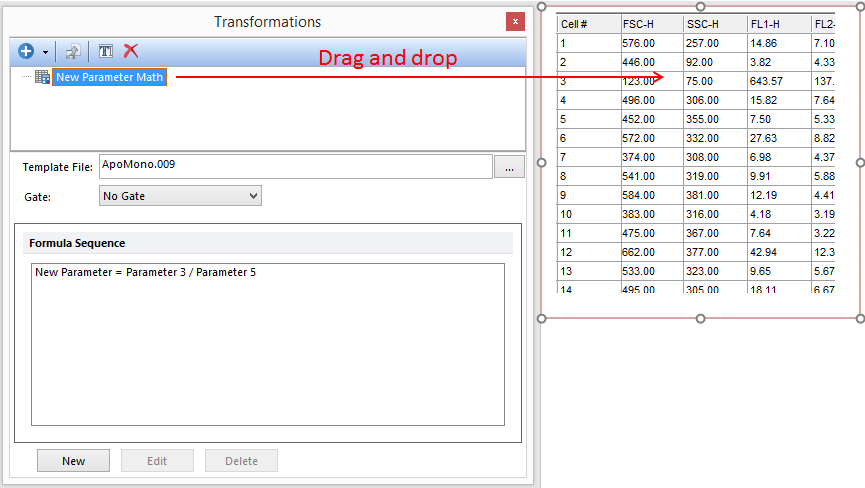
Figure 18.10 - Applying parameter math transformation to a plot by dragging from the Transformations navigator to the data grid (red arrow).
| • | 右击Data Grid(数据网格)→Show Transformed Values(显示转化值)→从菜单中选择合适的转化。(图1811)。 |
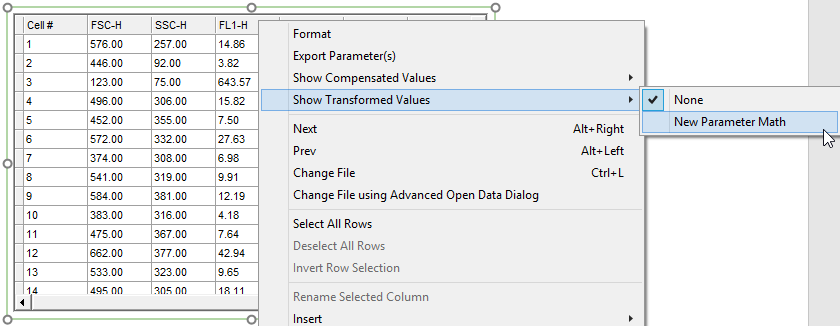
Figure 18.11 - Accessing parameter math transformation by right-clicking data grid and navigating to Show Transformed Values menu.
| • | 进入 格式对话框→Data Options(数据选项)→在Transformation(转化)下拉菜单中选择参数数学→OK。(图1812)。 |
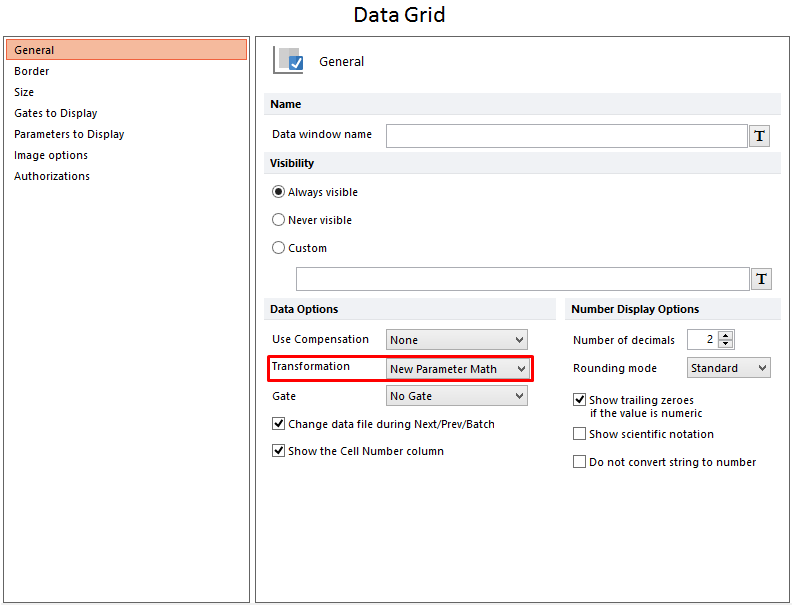
Figure 18.12 - Applying parameter math transformation to a data grid by selecting the parameter math in the Transformation drop down from the Formatting Overlays dialog.
