2D Plot Statistics Options
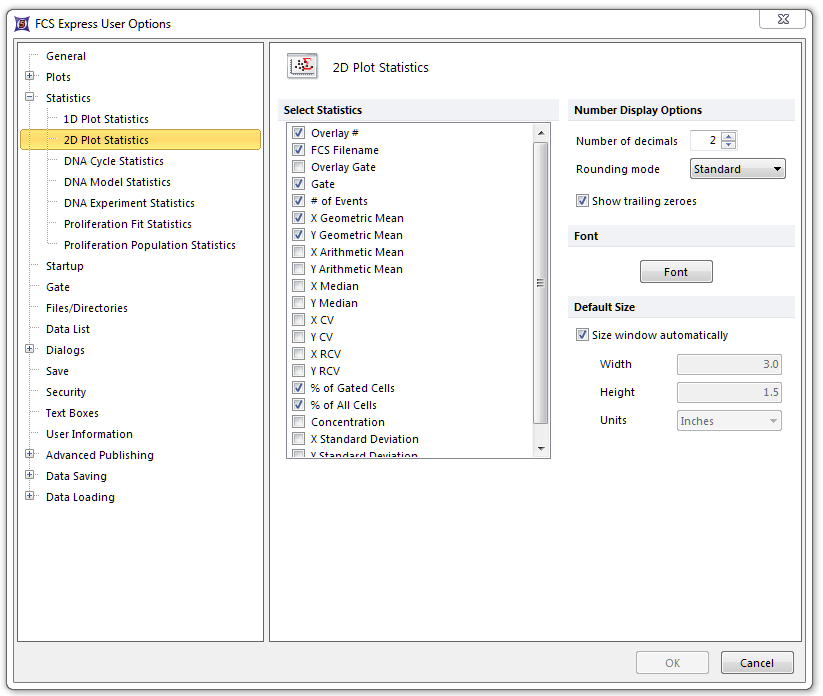
The 2D Plot Statistics options (Figure 8.17) determine the default visibility and display for 2D plot statistics.

Figure 8.16 2D Plot Statistics Options
The options are explained in the table below.
Option |
Explanation |
||||||
|---|---|---|---|---|---|---|---|
Select Statistics |
The check box determines whether or not statistic items are displayed when a statistics window is first opened. The individual statistics items are explained in the statistics section of the chapter on analysis of FCS data. |
||||||
Number Display Options |
|
||||||
Font |
The default font to use when displaying the statistics. |
||||||
Default Size |
Sets the default size of the statistics window. If Size window automatically is checked, size will automatically adjust if data is added that extends beyond the window borders. |
