Axes
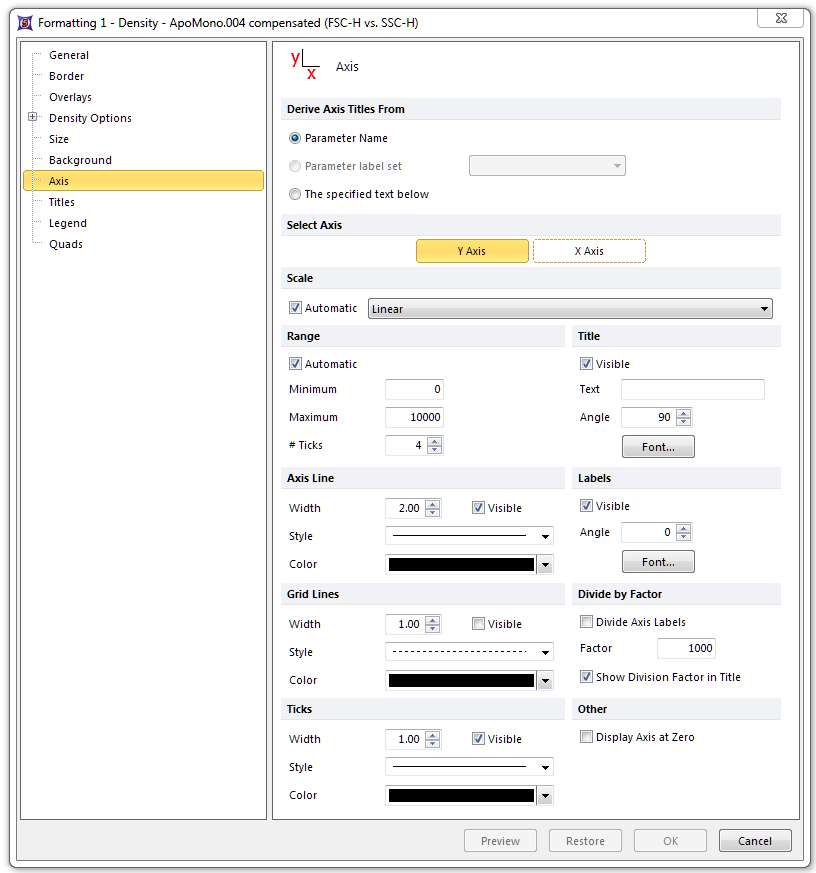
The Axis options control the appearance and text of the plot axes.
You can edit the Axes options in one of two ways:
| • | Select the plot and use the Format→Plot Options→Axes command. |
| • | Right-click on the plot, select Format from the pop-up menu, and choose the Axis category (Figure 8.57). |

Figure 8.54 Formatting Axes Dialog
The options are explained in the table below. With the Visible checkbox, where present, you can determine if the option is displayed or not.
Option |
Explanation |
||||||||||||
|---|---|---|---|---|---|---|---|---|---|---|---|---|---|
Derive Axis Titles From |
Choose Parameter Name, a Parameter label set (if a label set has been defined), or the text specified in the Text field (under Title). |
||||||||||||
Select Axis |
Select the Y Axis or X Axis to determine which axis is currently being edited. |
||||||||||||
Scale |
If Automatic scaling is checked, the axis will be shown in the scale chosen automatically by FCS Express for that parameter (from the $PnE keyword). You can override automatic scaling, and choose the axis scaling. |
||||||||||||
Range |
For all axes displaying data:
|
||||||||||||
Title |
Set the visibility, specific text, font style, size, color, and angle for the title of the axis parameter. |
||||||||||||
Axis Line |
Set the Axis Line visibility, style, color, and thickness. |
||||||||||||
Labels |
Set the visibility, font style, size, color, and angle for the numbers which label the scale. |
||||||||||||
Grid Lines |
Set the Grid Lines' visibility, style, color, and thickness. |
||||||||||||
Divide by Factor |
Divide the nominal axis labels by a given factor, and choose whether or not to show the factor in the Axis title. |
||||||||||||
Ticks |
Set the visibility, color, and width for the linear/logarithmic tick markers. |
||||||||||||
Other |
If Display axis at zero is checked, the axis currently being edited will be displayed at zero rather than at the plot origin. |
