Creating a New Channel Calibration
To create a new channel calibration:
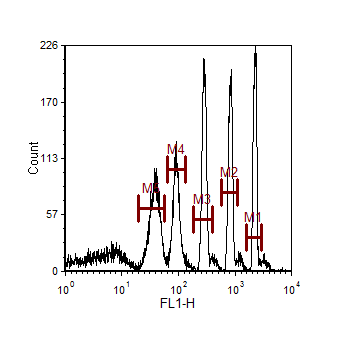
| • | Display the bead data in a histogram and create a marker bounding each bead as shown in Figure 15.1. |

Figure 15.1 Setting Up Markers for Channel Calibration
| • | Ensure that the plot being used as the raw data source for the calibration does not itself have calibration applied by following Steps 11-15 of the Channel Calibration tutorial. |
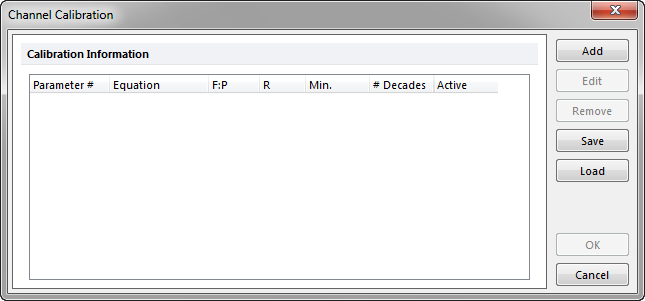
| • | Select the View tab→Tools→Channel Calibration command. The Channel Calibration window will appear (Figure 15.2). |

Figure 15.2 Channel Calibration Window
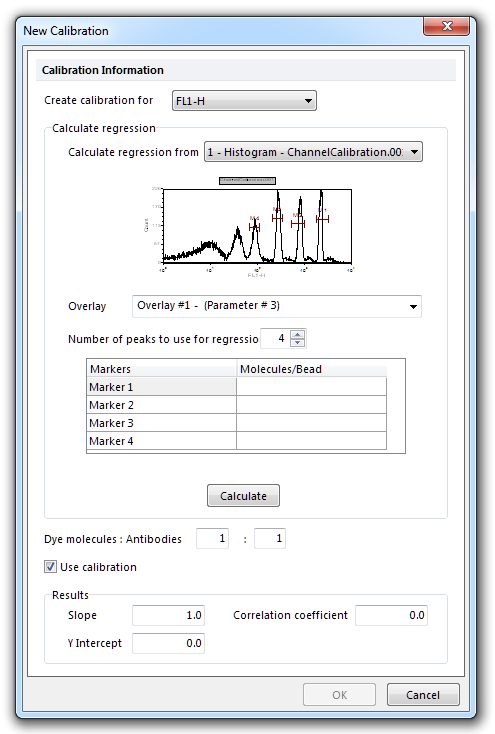
| • | Click Add to create a new calibration. The New Calibration dialog will appear (Figure 15.3). |

Figure 15.3 New Calibration Dialog
| • | Select the parameter you wish to create the calibration for in the Create calibration for drop-down list. |
| • | Choose the histogram which will serve as a data source for the calibration from the Calculate regression from dropdown list. |
| • | Select the correct overlay from the histogram in the Overlay drop-down list. When the histogram is selected, the marker box will automatically create an entry for every marker that exists on that histogram. You can choose to use fewer markers by changing the value in the Number of peaks to use for regression field. You must use a minimum of three markers to calculate the regression. |
| • | Enter the number of molecules per bead next to the marker for that peak. This information is supplied by the manufacturer of the beads. |
| • | Click Calculate to calculate the new channel calibration. The equation for the new calibration (Slope, Y Intercept, Correlation coefficient) will appear in the Results box. |
| • | The Dye molecules:Antibodies (also known as the F:P) ratio is typically 1:1, but you can change it to another value. The F:P ratio is supplied by the manufacturer of the antibodies you are using in your experiment. |
| • | Click OK to accept the new calibration. |
The channel calibration may now be saved, edited, or reloaded from the Channel Calibration dialog.
