Exporting Single Image Numeric Data

Contents
In this section, you will learn:
| • | How to export CellProfiler data from a set of single images that were not obtained from a 96 well plate in numeric form. |
This section pertains to data from a set of single images that were not obtained from a 96 well plate such as images obtained from a slide.
The CellProfiler modules that are needed or must be amended for export to FCS Express in this section are LoadImages and ExportToSpreadsheet. The completed pipeline for this example can be found in the Tutorial Sample Data archive and is named Section4pipelineCOMPLETED.cp. The completed pipeline is meant to be used as a template for comparison to your pipeline and represents the finished product of this tutorial.
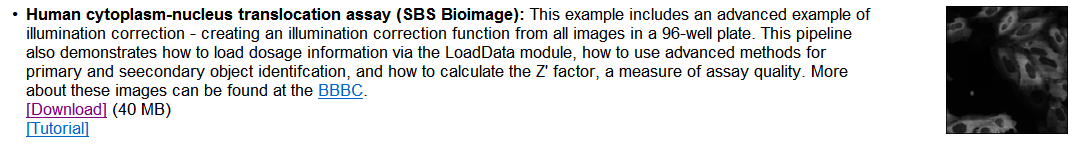
The sample images in the example data set we will be using can be found in the Tutorial Sample Data archive and are labeled "5 and 10 minute time point images". These images are based on the "Human cytoplasm-nucleus translocation assay (SBS Bioimage)" sample experiment found at CellProfiler Examples.
The steps for exporting data from CellProfiler have been broken down by module. After loading the Section4pipeline.cp, follow the steps below to amend the pipeline to prepare for export to FCS Express.
Selecting Default Input and Output Folders
To organize your data correctly for FCS Express, first ensure that the default input (where your images are stored) and output folders in CellProfiler are set to the same folder in the Input/Output Folder window.
Note: The DefaultOUT.mat file will also be exported to the Output Folder. This file is for use in MATLAB. If you do not wish to use this file, we recommend deleting it to conserve disk space.
LoadImages Module Setup
In order for FCS Express to recognize your data throughout the pipeline, metadata from the image file names must be extracted. A Regular Expression must be defined to find the metadata in the file name or path of the data by following these steps:
| 1. | Click on the Channel2- drop-down list labeled Extract metadata from where?. |
| 2. | Select which metadata you wish to use. For this example, choose File name. |
| 3. | Enter the "Regular Expression" you wish to use in the field labeled Regular expression that finds metadata in the file name. For this example, use "Channel2-(?P<time>[0-9]{2})-min.tif" which assigns a "time" label to the images in the data set based on the file name. |
Notes:
| • | Follow these links for a tutorial on "Regular Expressions" and how to translate regular expressions. |
| • | Setting up metadata and regular expressions only has to be done for one image in the set. For this example, it has been set up for channel 2. |
| • | The regular expression output names: Well, Row, Column, and Col may only be used with plate based or montage imaging experiments. Using any of these names for a single image experiment will result in a non-working export. |
ExportToSpreadsheet Module
Now that all of the images have been loaded and assigned to metadata, you must now ask CellProfiler to export the measurements you wish to view in FCS Express. For this example, we will export all measurements.
(Note: If you would like to only export certain parameters please see the Selecting Individual Parameters for CellProlifer Export section)
| 4. | Select or enter the column delimiter by choosing Comma (",") from the drop-down list. |
| 5. | Uncheck Prepend the output file name to the data file names?. |
| 6. | Choose Output file location as Default Output Folder from the drop-down list. |
| 7. | Uncheck Export all measurements. |
| 8. | Choose Image from the Data to Export drop-down list. |
| 9. | Uncheck Use the object name for the file name. |
| 10. | Type Image_ . |
| 11. | Right-click after "Image_" . |
| 12. | Select time from the regular expression pop-up menu. |
| 13. | Type .cptoc after "time". |
The file name should now look like Figure T24.32.
Figure T24.32 Inserting the "time" Variable into the File Name
Note: "time" is a value you defined from a regular expression in the LoadImages module. Using regular expressions allows every output file to be assigned a unique file name based on the text from the input file name. This will prevent output file names from overwriting each other and allow FCS Express to identify the unique image mask associated with each file.
| 14. | Choose Add another data set. |
| 15. | Choose Nuclei from the Data to Export drop-down list. |
| 16. | Uncheck Use the object name for the file name. |
| 17. | Type nuclei_ . |
| 18. | Right-click after "nuclei_" |
| 19. | Select time from the regular expression pop-up menu. |
| 20. | Type .cpout after "time". |
| 21. | Choose Add another data set. |
| 22. | Choose Cells from the Data to Export drop-down list. |
| 23. | Uncheck Use the object name for the file name. |
| 24. | Type cells_ . |
| 25. | Right-click after "cells_" . |
| 26. | Select time from the regular expression pop-up menu. |
| 27. | Type .cpout after time. |
The Export to Spreadsheet module options should look like Figure T24.33 when you are done.
Note 1: on file extensions: ".cptoc" stands for CellProfiler Table of Contents and ".cpout" stands for CellProfiler Output. The "Image.cptoc" file stores information about the location and number of images for all objects processed in the pipeline, while the separate "Nuclei.cpout" and "Cells.cpout" store the actual listmode data associated with individual objects and analysis. There should be a separate ".cpout" file defined for each object mask defined in CellProfiler. Only one "Image.cptoc" file is needed.
Note 2:The name of your .cpout file must begin with the name of the object data you are exporting and may only be include the object name and regular expressions. For example: the file names nuclei.cpout and nuclei_<regular express>.cpout will result in a proper export while dataset1nuclei.cpout or <regularexpression>_nuclei.cpout will resulting in a non-working export.

Figure T24.33 ExportToSpreadsheet Module
| 28. | Select Analyze images to run the pipeline. The folder where your images are stored will now contain the cells.cpout, nuclei.cpout, and Image.cptoc files for each time point (Figure T24.34). |
Note: The DefaultOUT.mat file will also be exported to the Output Folder. This file is for use in MATLAB, if you do not wish to use this file we recommend deleting it to conserve disk space.

Figure T24.34 Example of CellProfiler Output Folder When Analysis is Complete
In the next exercise, we will import and analyze single image numeric data.