Format to Change Resolution
From time to time your kinetics data files may not be displayed suitably with your default settings from the preferences. In this section, you will learn how to adjust resolution to view your data correctly, and how to show the standard deviation of your kinetics curves.
Although any kinetics data files of your own can be used to follow along, you have the option of using the same sample data files used in this tutorial. The sample data files are located in the Tutorial Sample Data archive. The KineticsTutorialScaling.fey, kinetics10.010, and kinetics25.025 data files will be used here.
| 1. | Select File tab→Open Layout. |
| 2. | Select the KineticsTutorialScaling.fey layout file located in the FCS Express Sample Data directory from the Load Layout dialog. |
The layout should look like Figure T21.21 below. The red highlighting is showing the standard deviation of the sample while the black line is displaying the Median of Fl-1. Sample kinetics10.010 is scaled correctly and is not showing standard deviation. Notice how sample kinetics25.025 has a very jagged black line and is displaying standard deviation. The jagged black line is occurring because the resolution on the plot is set too high. We will now format the kinetics25.025 plot to remove the standard deviation highlighting and adjust resolution to display the plot correctly.
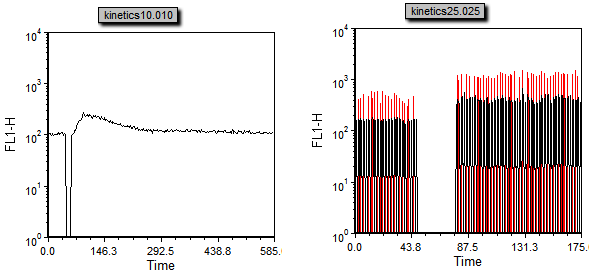
Figure T21.21 Kinetics Tutorial Layout After Adding Sample Data
| 3. | Click on the kinetics25.025 plot to select it. |
| 4. | Choose the Format→Plot Options→Overlays command. |
| 5. | Uncheck the Show Standard Deviation check box (Figure T21.22). |
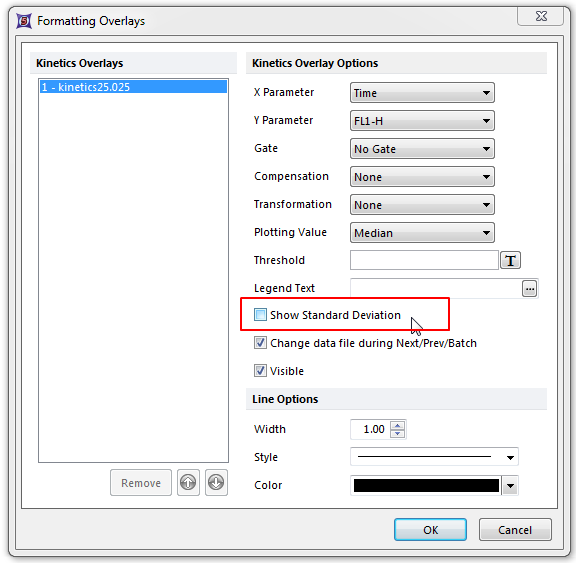
Figure T21.22 Unchecking Show Standard Deviation
| 6. | Click OK. |
The red standard deviation highlighting will now be removed as in Figure T21.23.
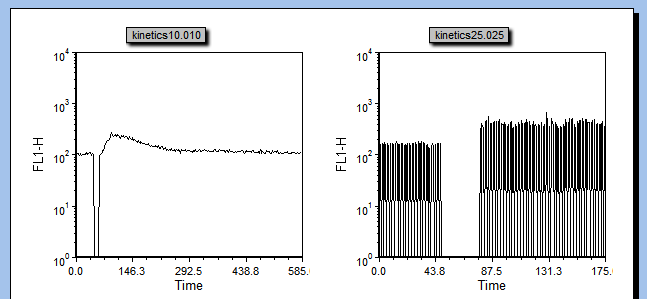
Figure T21.23 Sample Plots with Standard Deviation Highlighting Removed
We will now change the resolution of sample kinetics25.025 to display the plot properly.
| 7. | Right-click on the kinetics25.025 plot. |
| 8. | Choose Format from the pop-up menu. |
| 9. | Choose the Kinetics Option→Binned Plot Specific Options category. |
| 10. | Click on the Resolution drop-down list under Resolution Options (Figure T21.24). |
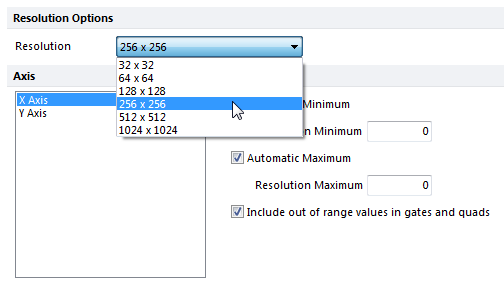
Figure T21.24 Changing the Resolution on a Plot
| 11. | Highlight the 64x64 resolution option. |
| 12. | Click OK. |
The plot will now change and be scaled properly as seen in Figure T21.25.
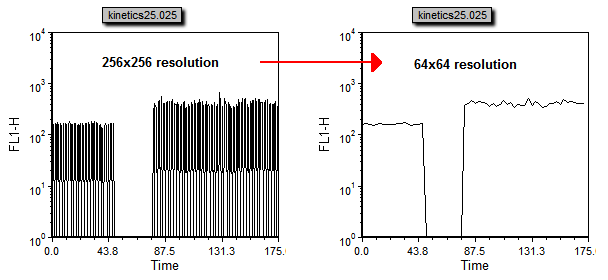
Figure T21.25 Changing the Resolution: 256x256 (Left) to 64x64 (Right)
After following the instruction above, the layout should look like Figure T21.26.
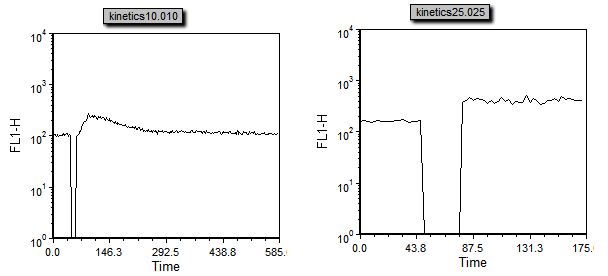
Figure T21.26 Kinetics Plots Scaled Properly
We will now apply standard deviation highlighting to both of the plots.
| 13. | Hit Ctrl+A to select all plots. |
| 14. | Choose the Format→Plot Options→Overlays command. |
| 15. | Change the Gate to Gate 1. |
| 16. | Check the Show Standard Deviation check box. |
| 17. | Click OK. |
The layout should now look like Figure T21.27.
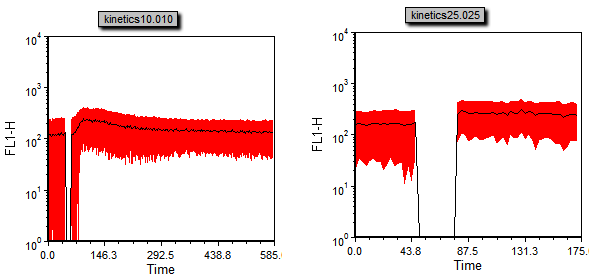
Figure T21.27 Kinetics Plots with Standard Deviation Highlighting Applied
