Histogram Statistic Token Options
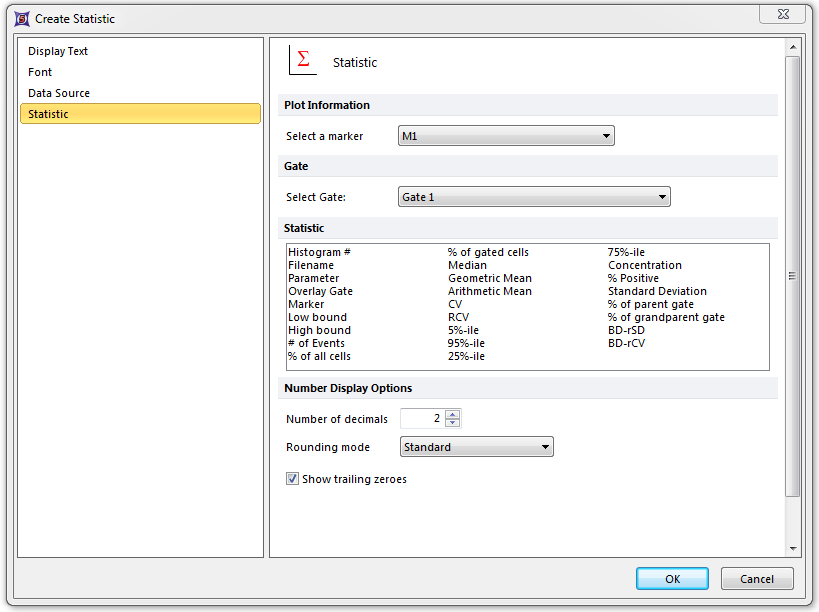
If a histogram is the Plot type chosen for a Data Source of a Statistic Token, the following properties can be set (Figure 19.12).

Figure 19.12 Statistic Options - Histogram as Data Source
| • | Plot Information |
Select a marker from the drop-down list to use as a basis for your statistic. The default selection is None which will use all events on the plot.
| • | Gate |
Choose a gate from the drop-down list (if the histogram data is based on a gate from a 2D plot). The default is No Gate.
| • | Statistic |
Select the statistic to display. See Histogram Statistics for descriptions of each.
| • | Number Display Options |
Select the number of decimals to be displayed for this statistic and the rounding mode to be used for this statistic. The options include Standard, Down, Up, and Truncate. The default value is 2 decimal places. You can also choose whether or not to display trailing zeroes.
