Legend
Legend formatting options control the appearance and position of the legend in relation to the plot.
You can edit the Legend options in one of two ways:
| • | Select the plot and use the Format→Plot Options→Legend command. |
| • | Right-click on the plot, select Format from the pop-up menu, and choose the Legend category (Figure 8.56). |

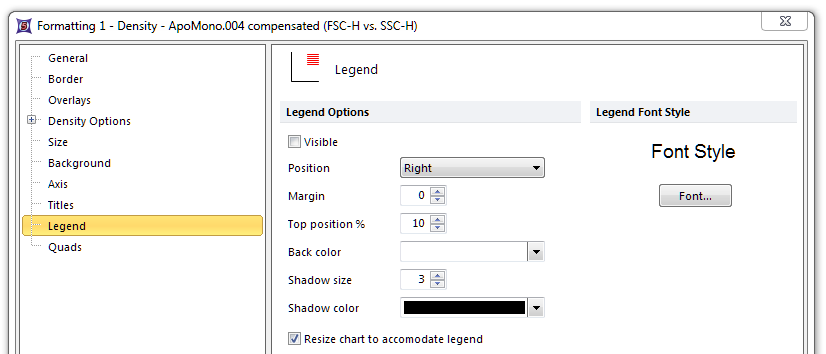
Figure 8.53 Formatting Legend Dialog
The options for legends are explained in the table below.
Option |
Explanation |
|---|---|
Visible |
Check or uncheck the checkbox to turn the legend on or off. |
Position |
Set the legend to the right, left, top, or bottom of the plot. |
Margin |
Sets how far the legend is from the plot. Margin = 0 calculates the margin automatically. |
Top position % |
Sets where the top of the legend is located. |
Back color |
Sets background color of the legend. |
Shadow size and color |
The number sets the size of the shadow; use 0 for no shadow. Choose the color from the drop-down list. |
Resize chart to accommodate legend |
Enabling the checkbox will resize the plot to accommodate the legend. The legend and plot events will overlap if the option is unchecked. |
Font... |
Customize the Legend font style, size, and text color. |
