Proliferation Position Markers
Position Markers can be displayed on Proliferation histograms to mark the position of the undivided cells peak and/or the background region.
To format proliferation position markers:
| 1. | Right-click on the Proliferation histogram. |
| 2. | Choose Format from the pop-up menu. |
| 3. | Click on the triangle next to Proliferation to expand the category. |
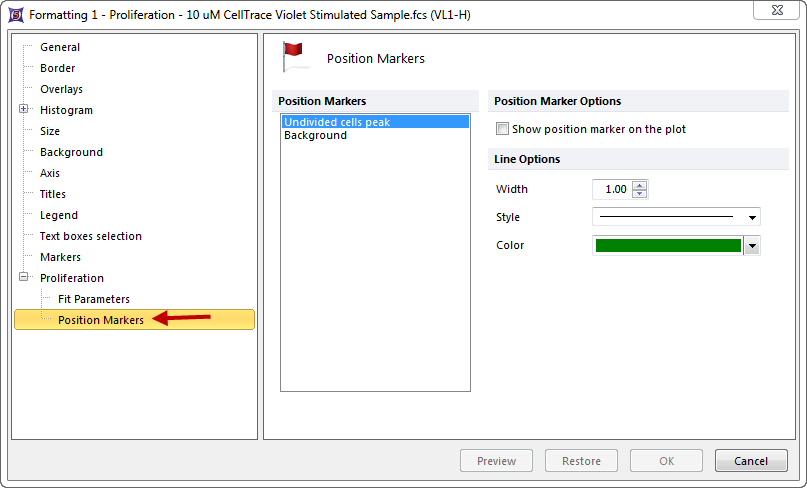
| 4. | Select the Position Markers category. |
| 5. | To make the position marker for a specific peak, select the peak and check the box for Show position marker on the plot. |
Select the Undivided cells peak and/or Background properties from the list box on the left (Figure 26.3) and choose line options for the selected markers on the right.

Figure 26.3 Formatting Proliferation Position Markers
