Excel Report (Column Mode)
A Column Mode batch analysis report can be created in a similar fashion as the Cell Mode.
In this exercise we will:
•Create an Excel Column Mode batch analysis report.
•Add a statistic token to the report.
•Add a keyword token to the report.
•Add a picture to the resulting Excel spreadsheet.
For convenience, we are going to start with the same layout as before. The images contained within this section will continue with the layout from the previous section. However, you can add reports to layouts that already have actions defined. If you have the previous layout still open, please jump to Step 5.
1.Select the File tab and click on Open.
2.Open the layout BatchProcess.fey found in the Tutorial Sample Data archive.
To Perform an Excel Report Batch Process:
3.Create a Data List with files TCellSample1.fcs and TCellSample2.fcs (see Steps 4-6 of the previous section).
4.Select the Batch tab→Batch Processing→Batch Actions command (Figure T9.6).
A Batch Actions window will appear (Figure T9.7). Please note that if you have the previous layout still open the Batch Actions window will also shows the Batch Actions from the (Figure T9.29)
We will now dock the Batch Actions window to the left side of the layout. Docking the Batch Actions dialog makes it easier to drag and drop plots and tokens while the rest of the layout remains in view, allowing you to set up the batch process actions very quickly. Please refer to the Docking Tutorial for more details on using the docking feature in FCS Express.
5.Move the Batch Actions window so that you see a four-headed icon in the center of the FCS Express window (Fig. T. 9.31)
6.Release the mouse on the left side of the icon so that both it and the left side of the FCS Express window become highlighted (Fig. T. 9.31). The Batch Actions window is now docked to the left side of the FCS Express window (Fig. T. 9.31, right).
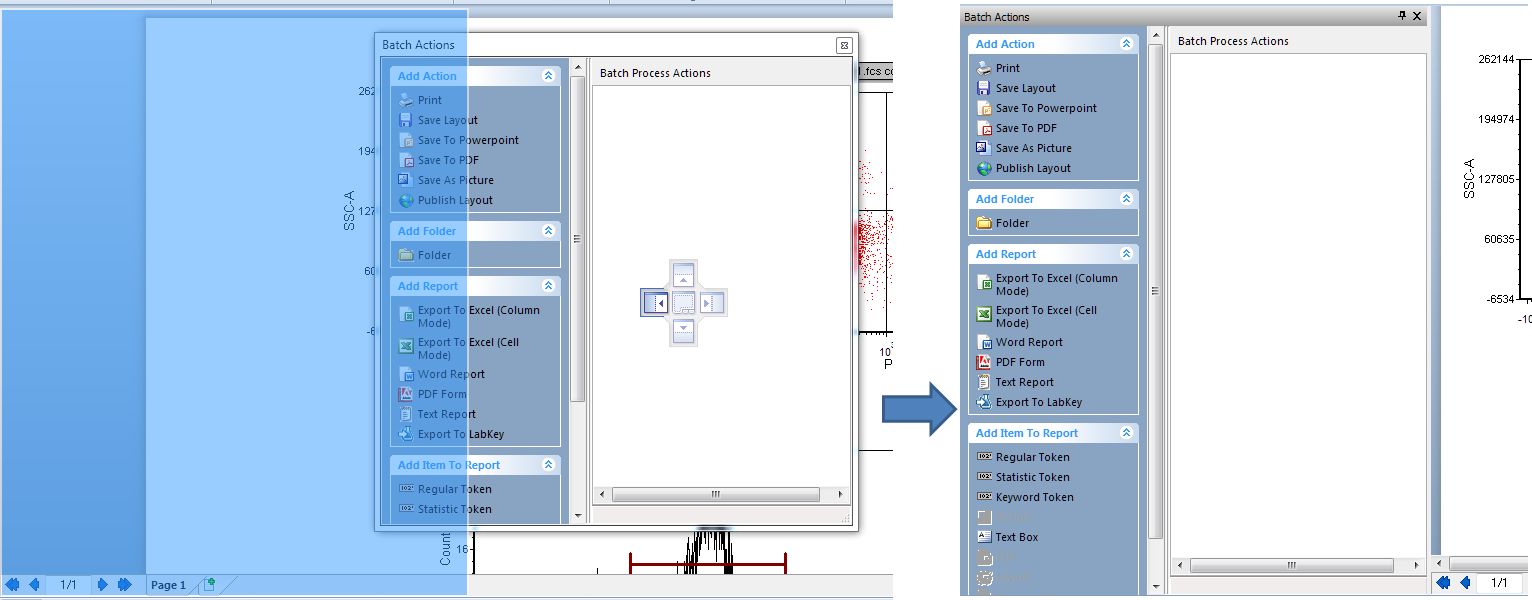
Figure T9.31 Docking the Batch Actions window.
7.Select Export to Excel (Column Mode) from the Add Report category (Figure T9.32, ![]() ).
).
An Excel (Column Mode) Options dialog appears (Figure T9.32, right).
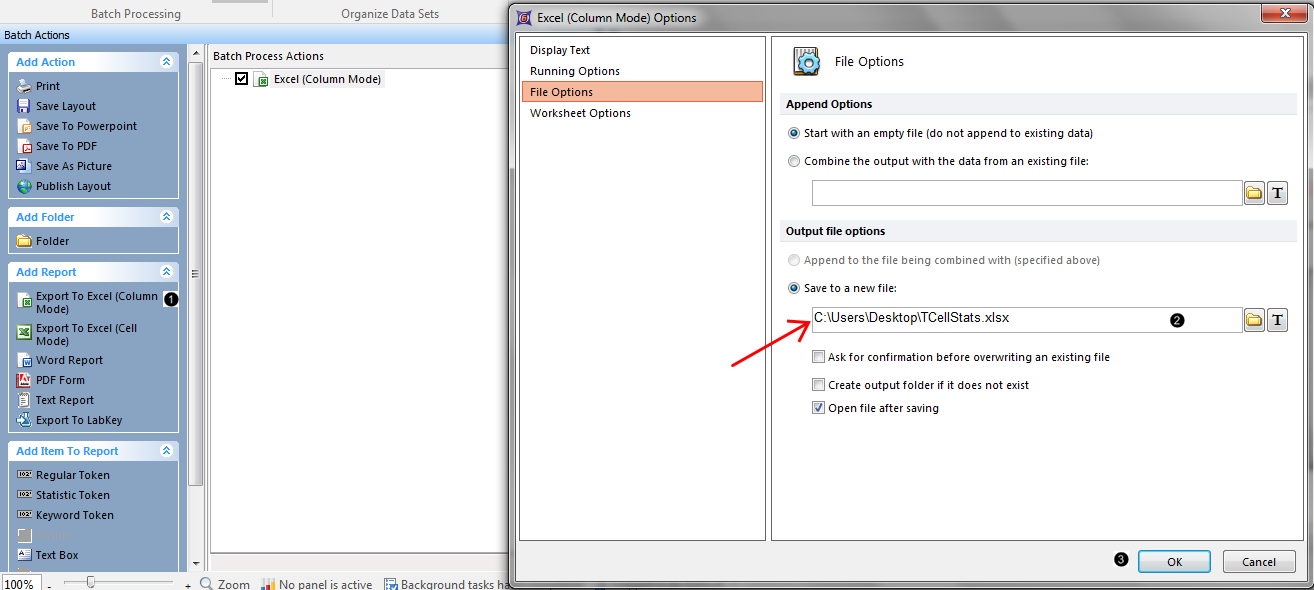
Figure T9.32 Excel (Column Mode) Options Dialog
8.In the Save to a new file field, click on the Folder icon (Figure T9.32, ![]() ) to navigate and specify where you would like to save your file and give it a name (e.g., "TCellStats" saved on the Desktop in Figure T9.31).
) to navigate and specify where you would like to save your file and give it a name (e.g., "TCellStats" saved on the Desktop in Figure T9.31).
9.Click OK (Figure T9.32, ![]() ).
).
An Excel (Column Mode) process will now appear in the Batch Process Actions section of the window (Figure T9.33, mouse pointer). We will now add three items to the report (a keyword token, a statistic token, and a picture of a plot from our layout).
10. Drag and drop the border of the upper-left plot on the layout onto the Excel (Column Mode) action (Figure T9.33).
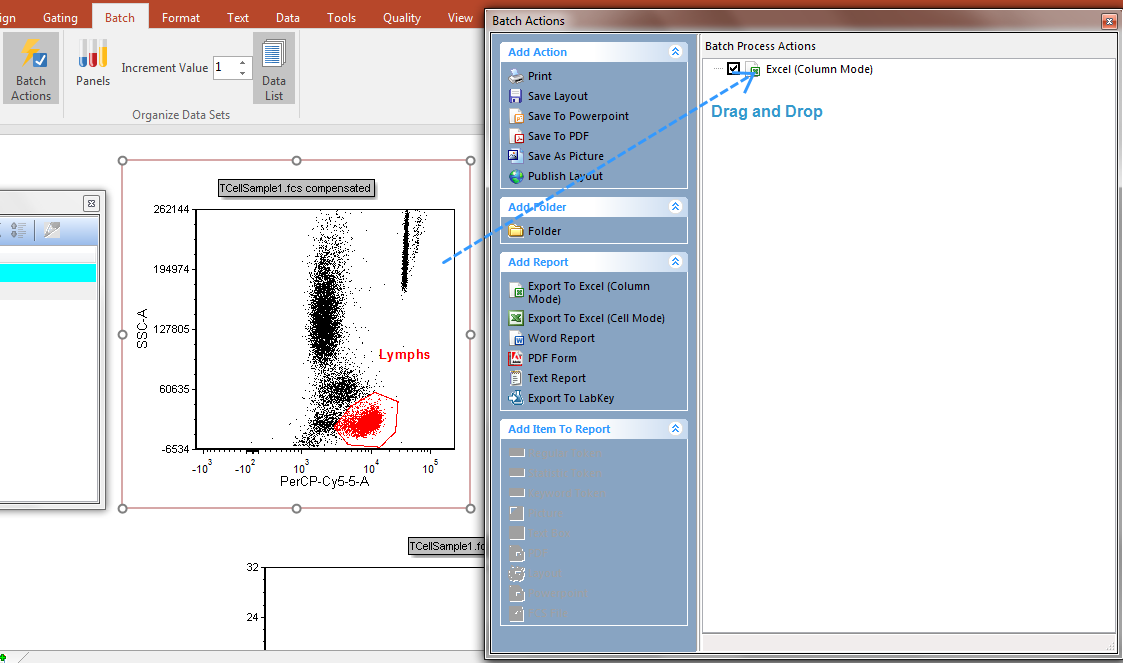
Figure T9.33 Dragging and dropping a plot to serve as data source for a token to be added to the report
11. Double-click Keyword token from the Paste Special dialog (Figure T9.34, ![]() ).
).
12. Click on the ellipsis in the Excel (Column Mode) field "Keyword..." options dialog (Figure T9.34, ![]() ).
).
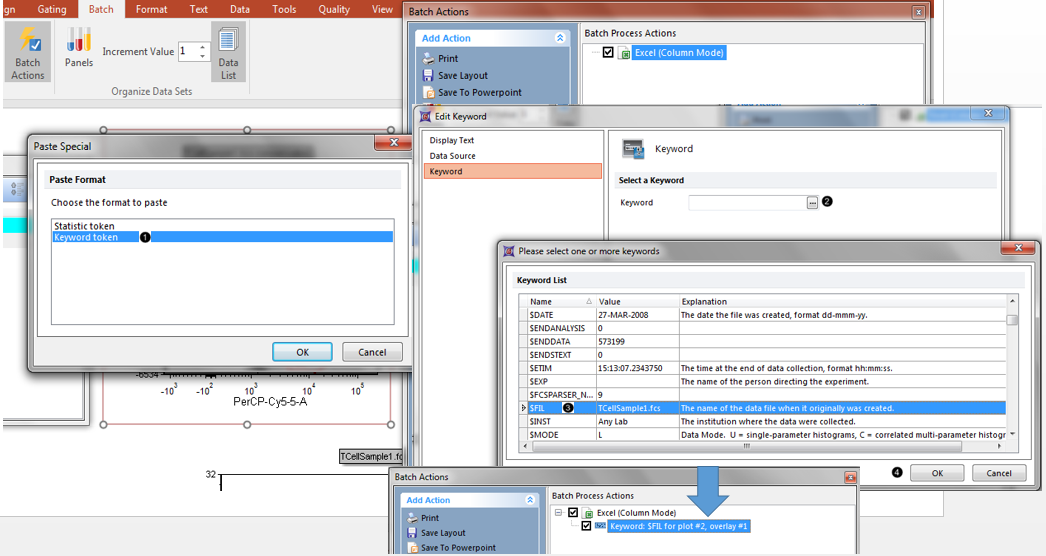
Figure T9.34 Adding a keyword token to the report
13. Scroll to and select $FIL in the Please select a keyword dialog (Figure T9.34, ![]() ).
).
14. Click OK in the Please select a keyword dialog (Figure T9.34, ![]() ).
).
15. Click OK in the Excel (Column Mode) field "Keyword..." options dialog (Figure T9.33). The Keyword token has now been added as an item to the Excel (Column Mode) report (Figure T9.34, bottom).
16. Drag and drop the border of the histogram on the layout onto the Excel (Column Mode) action (similar to Figure T9.33, but we are dragging a different plot).
17. Double-click Statistic token from the Paste Special dialog (Figure T9.35, ![]() ).
).
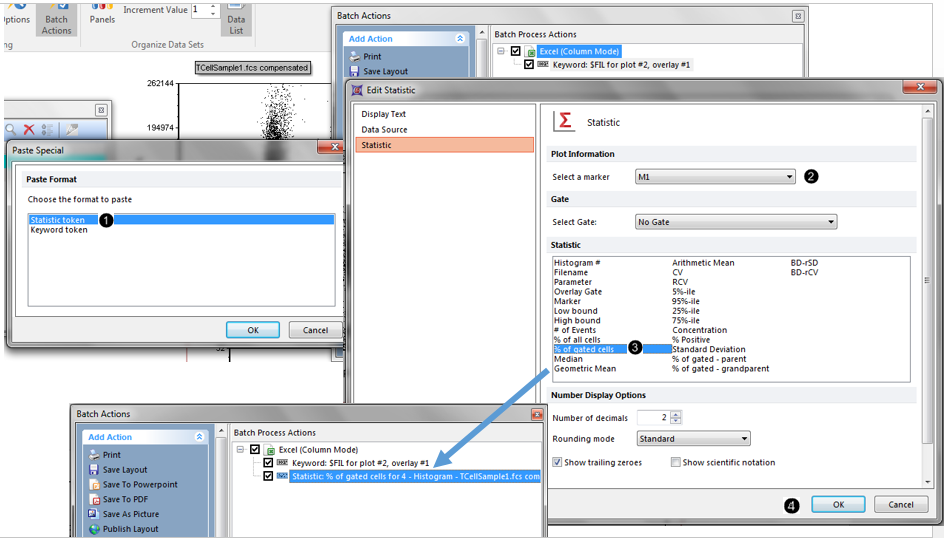
Figure T9.35 Adding a statistic token to the report
18. Select "M1" from the Select a marker dropdown menu of the Excel (Column Mode) field "Statistic..." options dialog (Figure T9.35, ![]() ).
).
19. Select % of gated cells from the Statistic list box (Figure T9.35, ![]() ).
).
20. Click OK in the Excel (Column Mode) field "Statistic..." options dialog (Figure T9.35, ![]() ). The Statistic token has now been added as an item to the Excel (Column Mode) report (Figure T9.34, bottom).
). The Statistic token has now been added as an item to the Excel (Column Mode) report (Figure T9.34, bottom).
Note: you can also drag and drop gates directly from plots onto the Excel Batch Action.
21. Deselect the check boxes next to the Export to Powerpoint and Excel (Cell Mode) batch actions, if these exist on your layout (Figure T9.36).
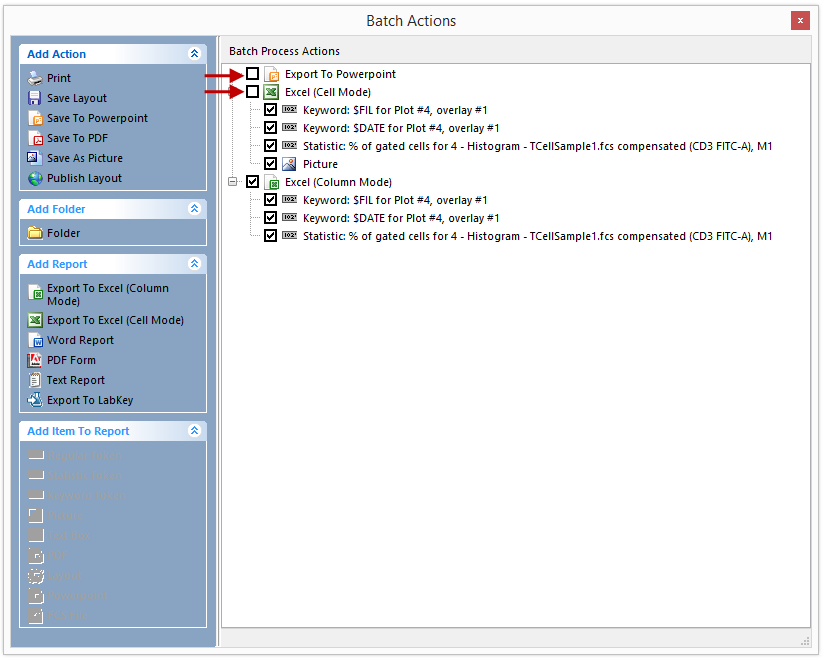
Figure T9.36 Deselect Excel (Cell Mode) to Batch Process Only Excel (Column Mode)
Now we are ready to run the Batch Processing to export to Excel (Column Mode).
22. Select the Batch tab→Batch Processing→Run→Run command (Figure T9.10).
An Excel (Column Mode) report will appear with the results of the batch process (Figure T9.37).
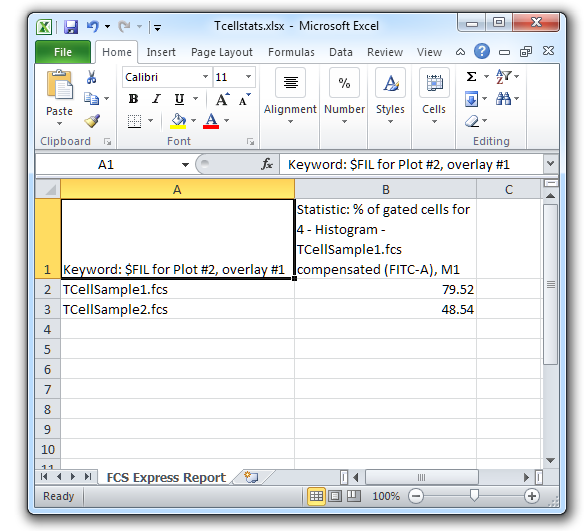
Figure T9.37 Excel (Column Mode) Report
We will now insert the image of a plot from FCS Express onto the Excel spreadsheet using drag and drop.
23. Drag and drop the border of the histogram on the layout onto an empty part of the Excel spreadsheet (Figure T9.38).
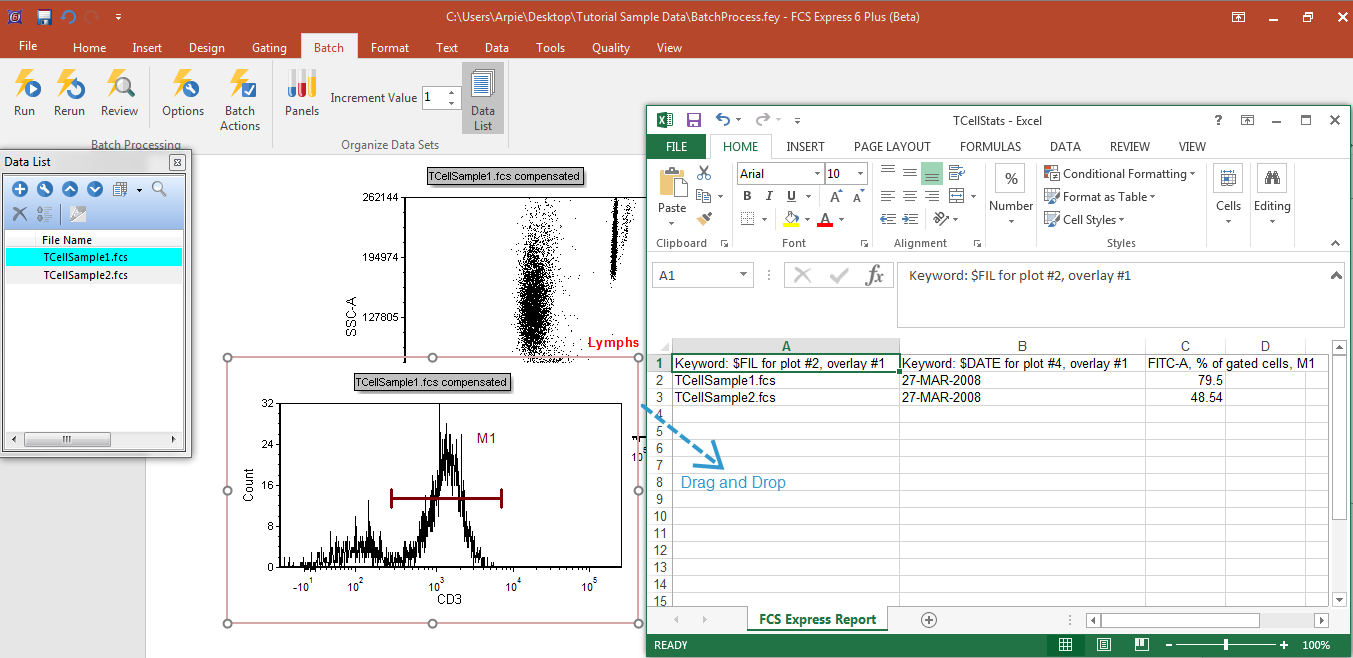
Figure T9.38 Dragging and Dropping a Plot Image from FCS Express to an Excel Spreadsheet
An image of the histogram plot will now appear in the Excel spreadsheet (Figure T9.39). You can drag and drop items from FCS Express to Word and PowerPoint in a similar manner.
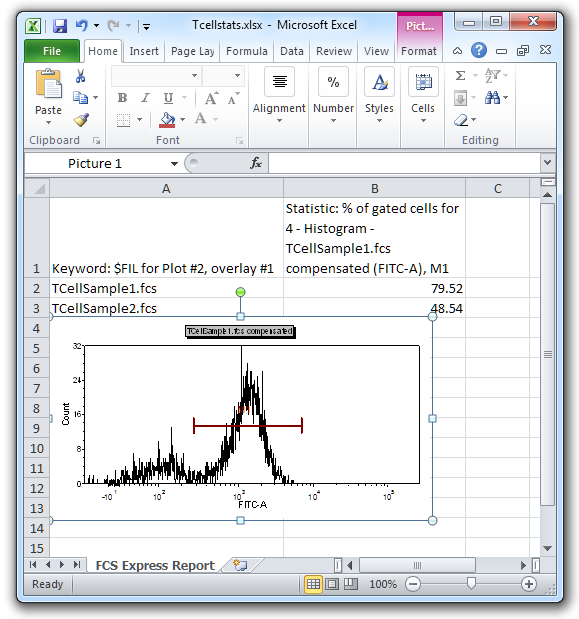
Figure T9.39 Excel (Column Mode) Report with a Plot Image Added
