Formatting
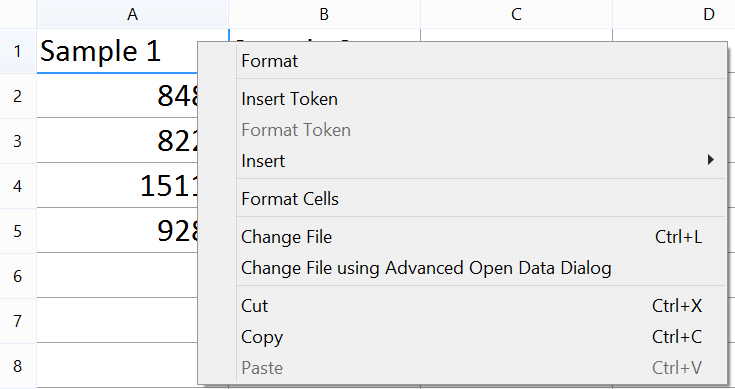
Spreadsheets may be formatted just like any other object in FCS Express and contain many of the same formatting options as other objects. When right clicking on a Spreadsheet you will be presented with the option to Format or Format Cells (Figure 11.6). The Format command will allow you to access formatting commands for the Spreadsheet object itself for items like Name, Visibility, Border, Size, Authorizations.
The Format Cells command allows you to adjust formatting options specific to a cell or multiple cells / cell ranges. Please see the next section on Formatting Spreadsheet cells for additional information.

Figure 11.6 - The right click menu available with spreadsheets.
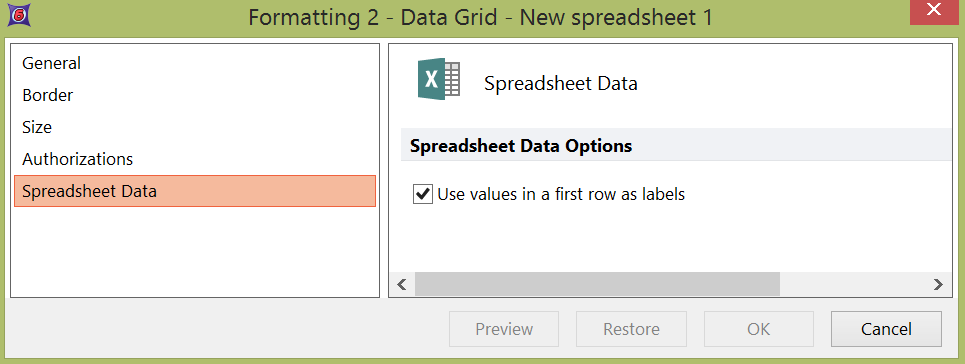
In addition to standard object formatting options spreadsheets have the additional formatting option to Use values in a first row as labels (Figure 11.7).

Figure 11.7 - Choosing to Use values in a first row as labels option.
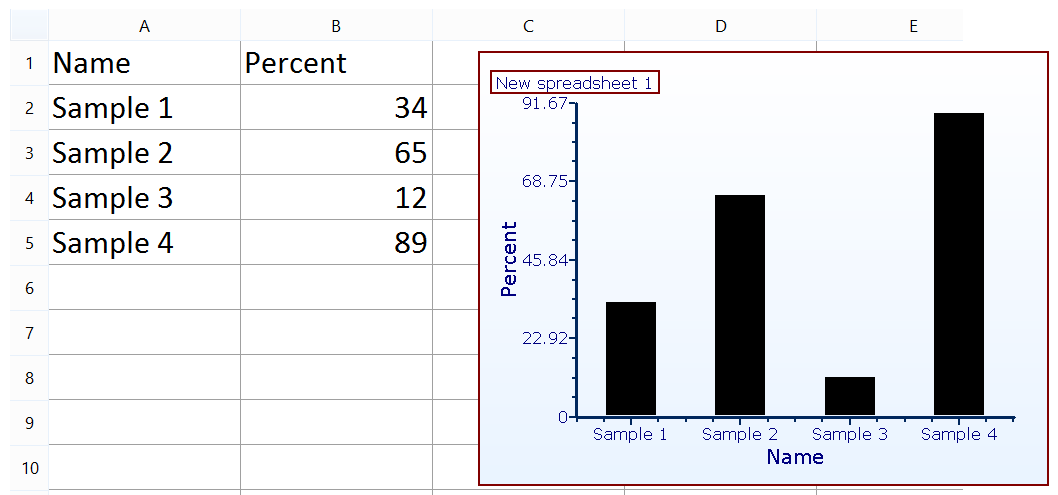
When the option is turned on by checking the box then the first row in the spreadsheet will be used as labels in any additional graph types as in figure 11.8 below.

Figure 11.8 - Choosing the Use values in a first row as label option enables bar plots, pie charts, scatter plots, and scatter with regression plots to use the first row in the spreadsheet as a data label.
