Formatting Plot Titles

Contents
In the course of this example, we will:
•Acquire an overview of formatting plot titles.
•Change the title text.
•Change the title font.
•Change the shadow size.
•Change the alignment of the title.
•Change the footer properties.
•Insert keywords.
To change the plot title (numbers refer to Figure T3.15):
1.Right-click on the top plot to open the pop-up menu.
2.Select Format from the pop-up menu (Figure T3.5).
3.Click on the Titles category from the Plot Formatting dialog (Figure T3.6).
The Formatting Titles category options shown in Figure 35.44 will appear.
4.Select Header from the Header/Footer list box ![]() .
.
5.Press the Font button ![]() and increase the font size to 12 pt.
and increase the font size to 12 pt.
6.Press OK on the Font dialog when you have changed the font size.
7.Replace the existing title with the text "Light Scatter" ![]() . This is the actual text that will appear as the title of the plot.
. This is the actual text that will appear as the title of the plot.
8.Change the Shadow Size to 0 to remove the shadow from the background of the header. ![]()
9.Select Right from the Alignment list to right align the title. ![]()
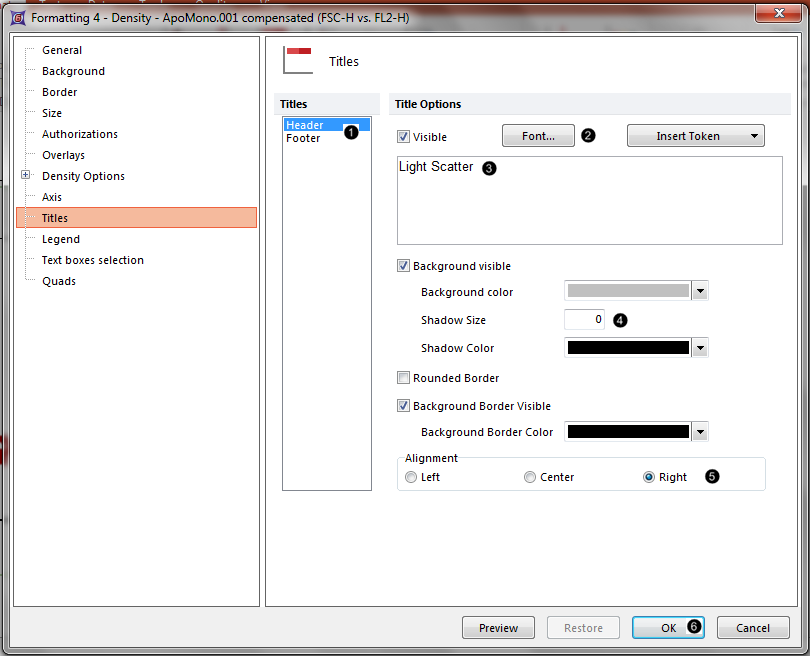
Figure T3.15 Formatting Titles Dialog
10. Press OK to apply the changes. ![]()
The plot should now look like the plot in Figure T3.16B.

Figure T3.16 Changing the Header Properties
Now, we will change the footer properties (numbers refer to Figure T3.18):
1.Right-click on the plot and select Format from the pop-up menu.
2.Click on the Titles category.
3.Select Footer from the Header/Footer list box ![]() .
.
4.Check the Visible checkbox ![]() to enable the visibility of the footer.
to enable the visibility of the footer.
5.Delete the $FIL keyword from the header text.
6.Press the Insert Token dropdown menu ![]() and select Keyword from Data from the dropdown list. The Keyword Dialog will appear (Figure T3.17). This allows you to insert any keyword that is located in the header of the FCS File as the footer for the plot. As the value of the keyword changes, (i.e., because you change the data file) the plot will automatically update with the correct value.
and select Keyword from Data from the dropdown list. The Keyword Dialog will appear (Figure T3.17). This allows you to insert any keyword that is located in the header of the FCS File as the footer for the plot. As the value of the keyword changes, (i.e., because you change the data file) the plot will automatically update with the correct value.

Figure T3.17 Select FCS Keyword
7. Select the $Date keyword (red arrow). This will insert the acquisition date.
8. Press OK.
9. Uncheck the Background visible checkbox ![]() .
.
10. Select Right from Alignment to right-align the footer ![]() .
.
The screen should look like Figure T3.18.
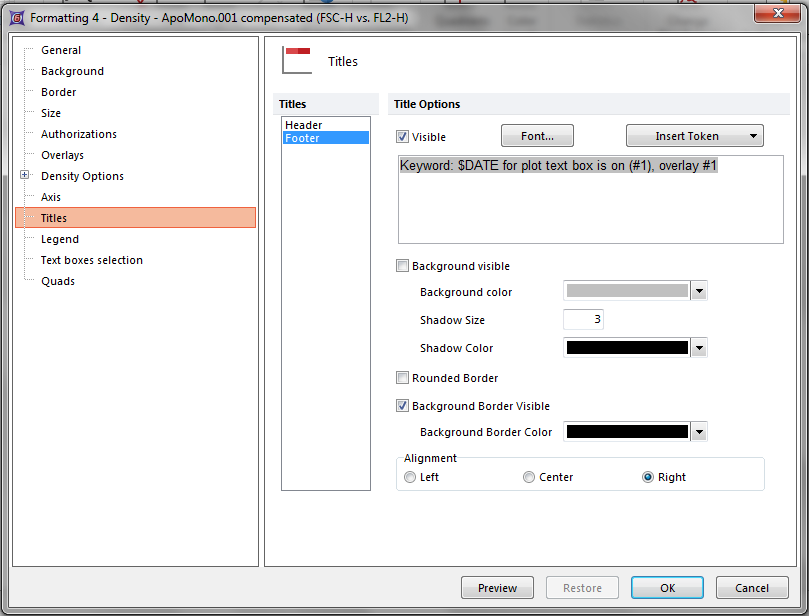
Figure T3.18 Formatting Titles Category (Footer)
11. Press OK to apply the changes.
The plot should now look like Figure T3.19B.

Figure T3.19 Changing the Footer Properties
Next, we will format the plot axes.