Loading a layout for analysis
In this section, we will:
1.Load and examine a layout with all the plots needed to perform an HLA cross-match.
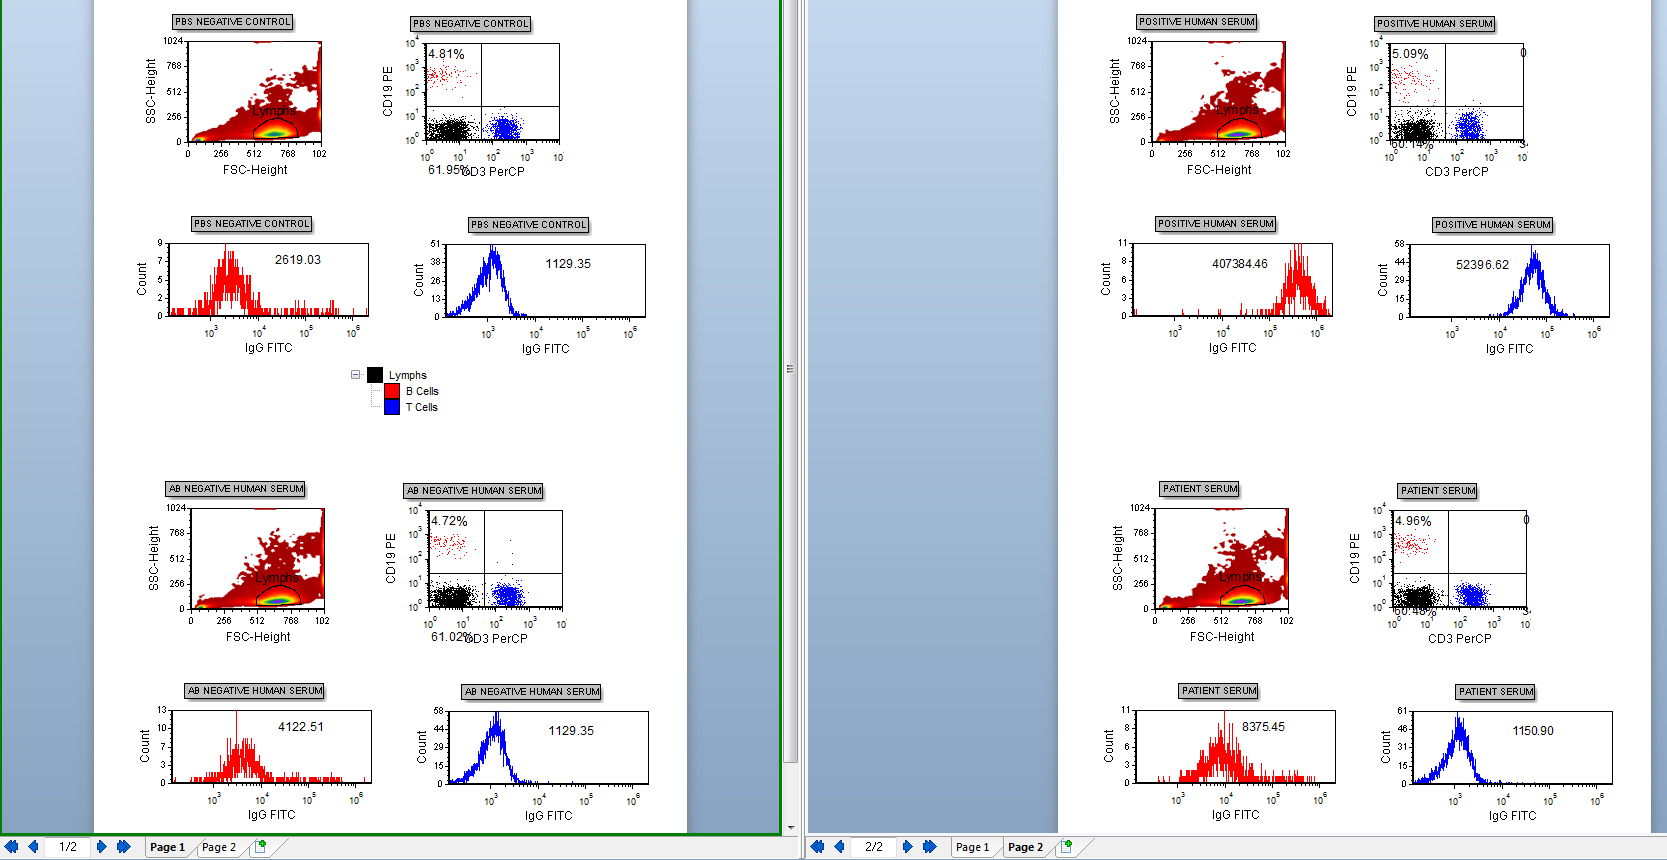
We will begin by loading a two page layout of HLA cross-match data. The layout contains data plots from two different negative controls, a positive control, and serum from a possible recipient patient.
2.Select File tab→Open.
3.Open the layout HLA Custom Data.fey found in the FCS Express Sample Data folder.
The two pages of the layout should appear as shown in Figure T15.1, with both pages being displayed next to each other.

Figure T15.1 HLA Custom Data.fey
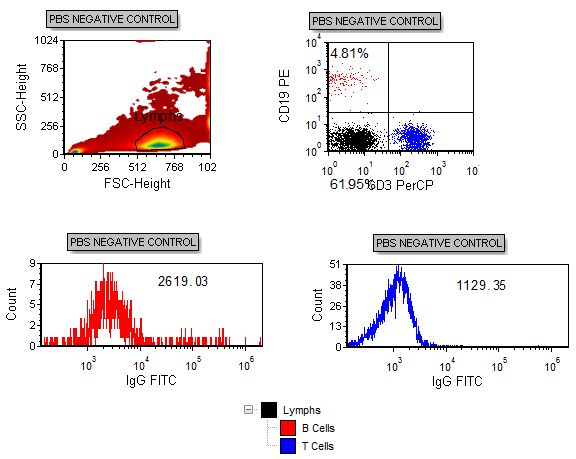
Let's begin by examining the first four plots on the top of Page 1, all labeled 'PBS NEGATIVE CONTROL', shown in Figure T15.2. The plot in the upper left corner is of the cells from the donor; a gate has been drawn around the lymphocyte population and labeled 'Lymphs'. The density plot in the upper right is gated on only the lymphocyte population and displays the CD3 positive T-cells, in the lower right quadrant (blue) and the CD19 positive B-cells, in the upper left quadrant (red). The two quadrants for the T- and B-cells have been converted to gates and are sub-gates, or children, of the Lymphs gate, as shown by the Gate View window. The two histograms on the bottom, from left to right, are gated on the B-cell population (red) and T-cell population (blue), respectively. The numbers inside the histograms are the median MESF values of the IgG FITC parameter of the T- and B-cells.
The other plots on the layout are duplicates of these four plots displaying the data from three other data files.

Figure T15.2 Layout of PBS NEGATVE CONTROL Plots and Gate View
Rather than using arbitrary channel values, the layout uses a Channel Calibration regression that was previously created from FITC MESF beads. This means the IgG FITC histograms use a calibrated FITC MESF scale. For more information on using beads in this way, please refer to the tutorial on Calibrating Fluorescence Using Beads. As shown in Figure T15.2, the median value from the PBS NEG CONTROL histogram of the B-cells is 2619.03. This means that the median intensity of the IgG FITC signal, from the soluble IgG bound to the B-cells of the donor cells, is approximately 2,619 MESF (Molecules of Equivalent Soluble Fluorochrome) of fluorescein.
Next, we will create a spreadsheet.
