Overlaying Spectrum Plots
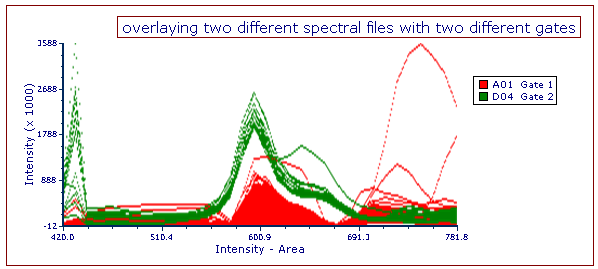
Spectrum Plots can be overlaid upon one another (e.g., Figure 28.8), in the same way that overlays are added to histograms and other plots in FCS Express. For details on creating and formatting these overlays, see the Overlays subtopic of Formatting 1D Spectrum Plots.

Figure 28.8 - Spectral plot with two overlays from different spectral datafiles, each with a different gate applied.
