Quadrant to Gate Linking
In the course of this example, we will:
•Link a quadrant to a gate.
•Move a quadrant with a linked gate and watch the gate automatically update.
To link a region to a quadrant:
1.Select File tab→Open Layout.
2.Open the layout Quad2RegionLink.fey found in the Tutorial Sample Data archive.
This layout contains three 2D Color Dots of the file TCellSample1.fcs (Figure T7.1). The left plot is of SSC-A vs. PerCP-Cy5.5-A with a gate on Lymphs, which are colored Red. The upper right plot is of FITC-A vs. APC-A gated on Lymphs with quadrants. The lower plot is a 2D Color Dot Plot looking at PE-Cy7 vs APC and gated on Lymphs.
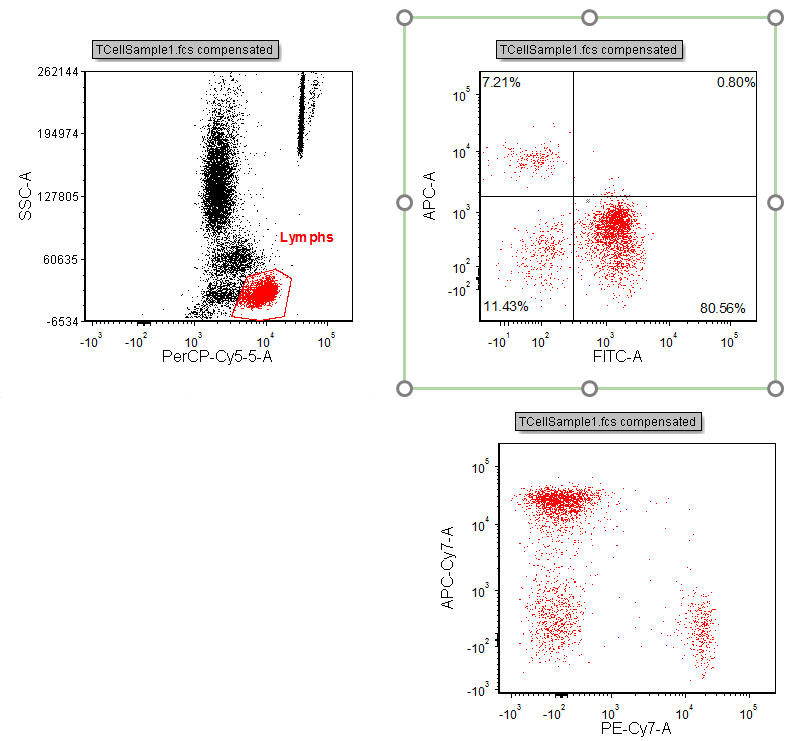
Figure T7.1 Quad2RegionLink.fey Layout
3.Right-click on the upper right 2D plot of FITC-A vs. APC-A with quadrants, shown with the green border in Figure T7.1.
This will bring up the associated pop-up menu (Figure T7.2).
4.Select Convert Quads to Gates→Lower Right→Convert and Link from the pop-up menu (Figure T7.2).
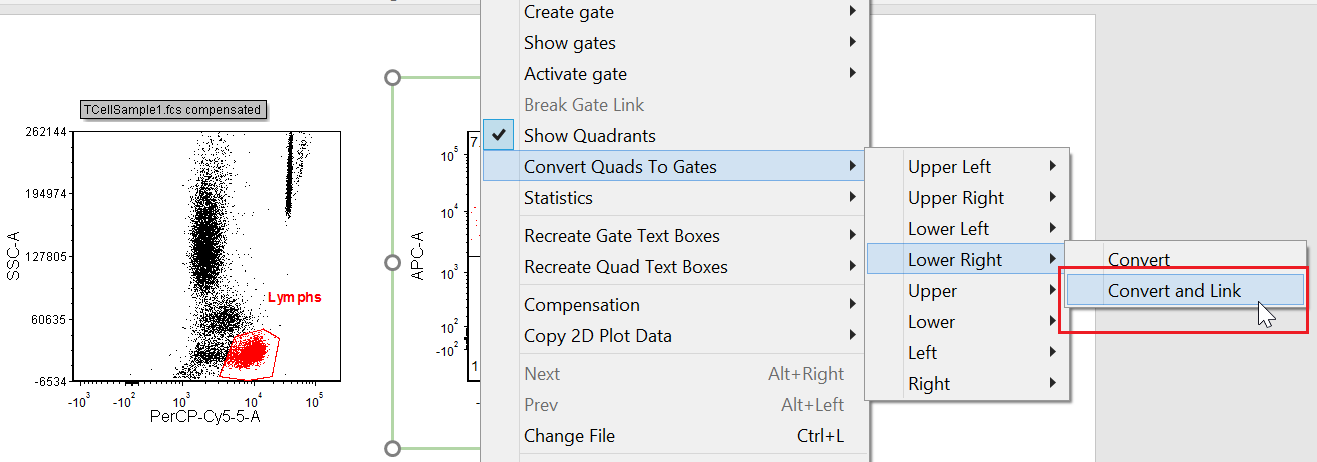
Figure T7.2 Converting and Linking the Lower Right Quadrant to a Gate
A Create New Gate dialog will appear (Figure T7.3). Here, we will name the new gate that will be linked to the lower right quadrant.
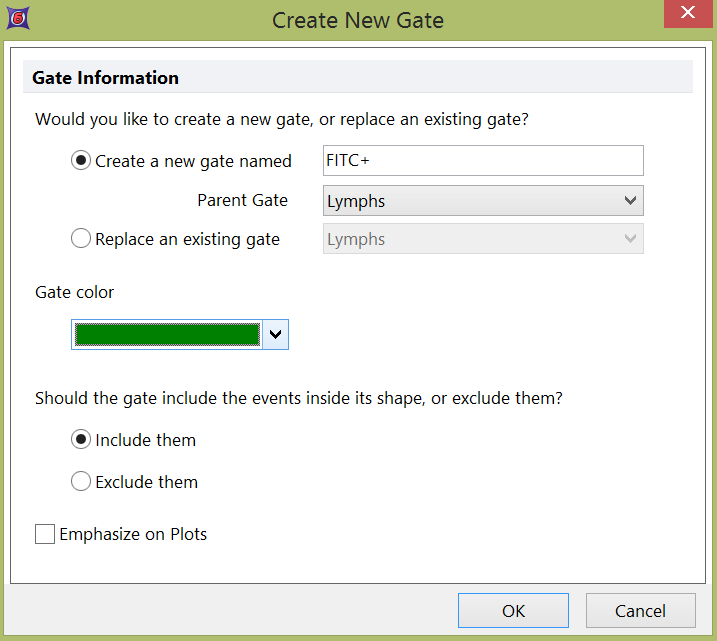
Figure T7.3 Create New Gate Dialog
5.Enter FITC+ in the Create a new gate named field.
6.Change the Gate Color to Green.
7.Click OK.
We will now apply the newly created FITC+ gate, that is linked to the lower right quadrant, to the lower right 2D plot.
7.Click inside the 2D plot of PE-Cy7-A vs APC-Cy7-A on the lower right without the quadrants. The border will appear green (Figure T7.4).
8.Select the Gating tab (Figure T7.4).
9.Select FITC+ from the Current Gate drop-down list (Figure T7.4).
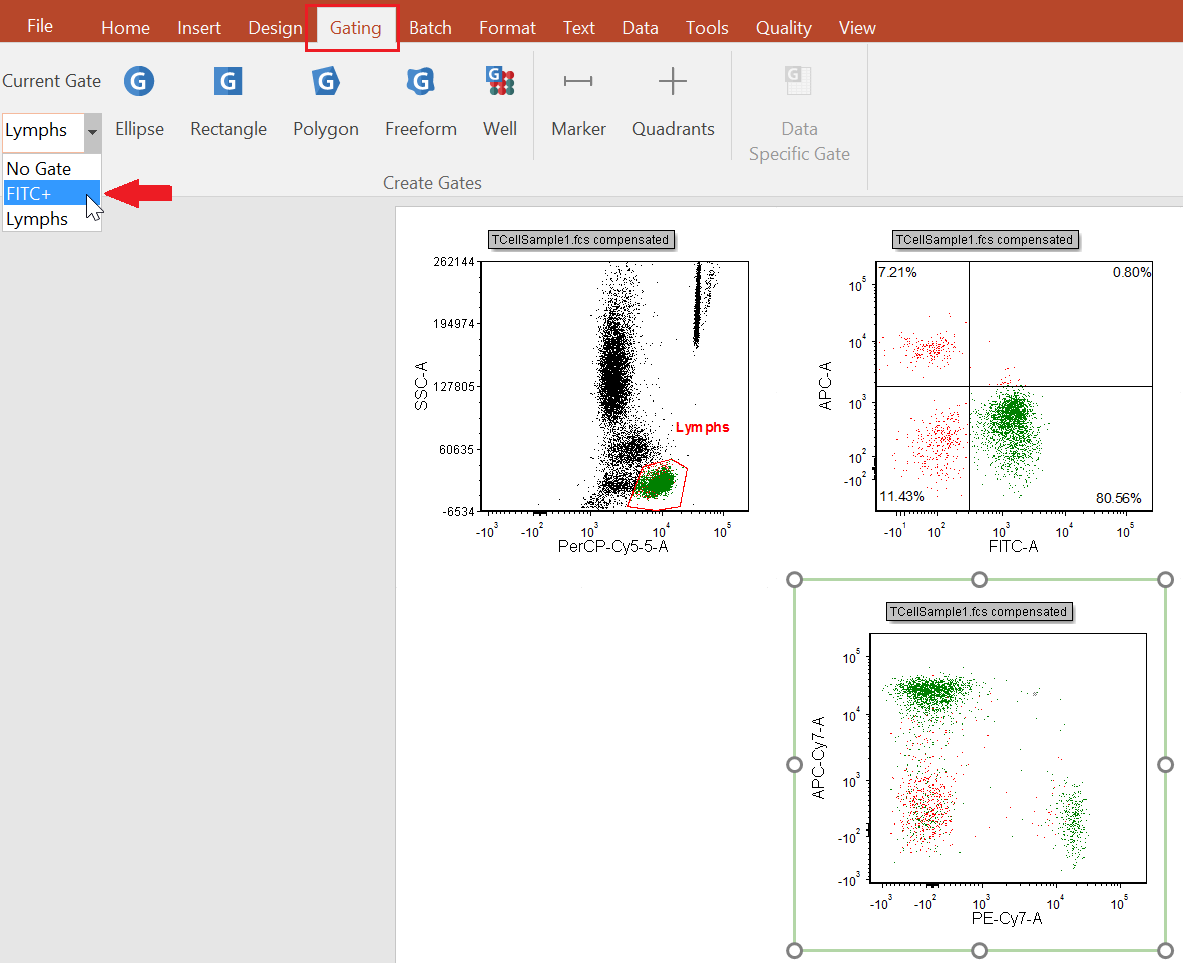
Figure T7.4 Selecting the FITC+ Gate for the Lower Right 2D Plot
The 2D plot on the lower right will now appear with only the events found in the lower right quadrant (Figure T7.5).
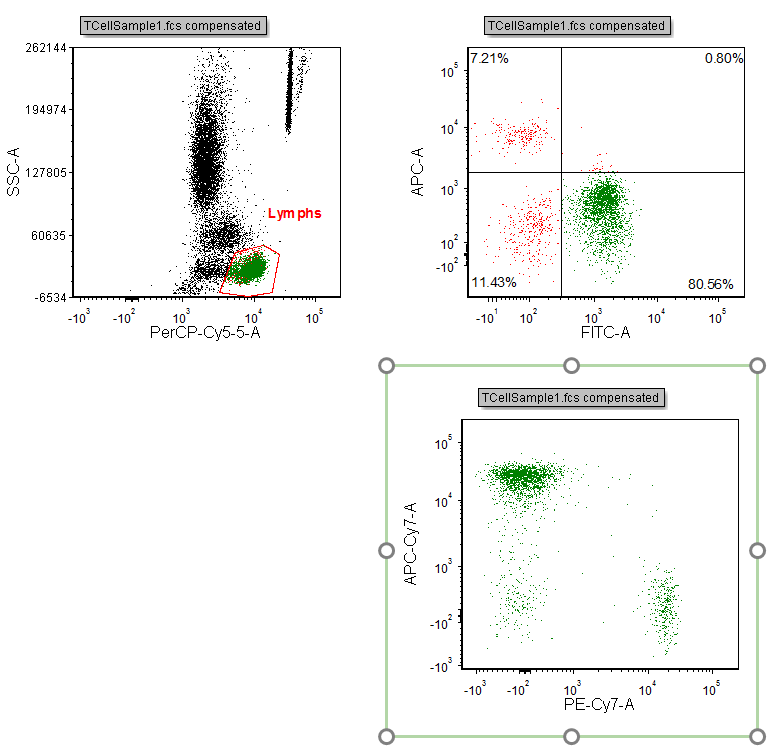
Figure T7.5 Lower Right Plot Gated on GFP(+)
Because the quadrants are linked to the gate, changing the quadrant position will also change the gate GFP(+). We will now move a quadrant to demonstrate how the GFP(+) gate linked to the quadrant will also change.
To move a quadrant:
10. Click inside the 2D plot of FL1 vs. FL2 with the quadrants on the upper right of the layout. The border will appear green (Figure T7.6).
11. Click on the vertex of the quadrant. You will know you have selected the quadrant for editing because the mouse will change to a four-headed arrow.
12. Press and hold the down the left mouse button on the vertex.
13. Move the mouse to the right while continuing to hold down the mouse button.
14. Release the mouse button when the lower right quadrant definition is smaller (Figure T7.6).
The Lower 2D plot of FL1 vs. FL2 will update to reflect the changes made to the lower right quadrant (Figure T7.6).
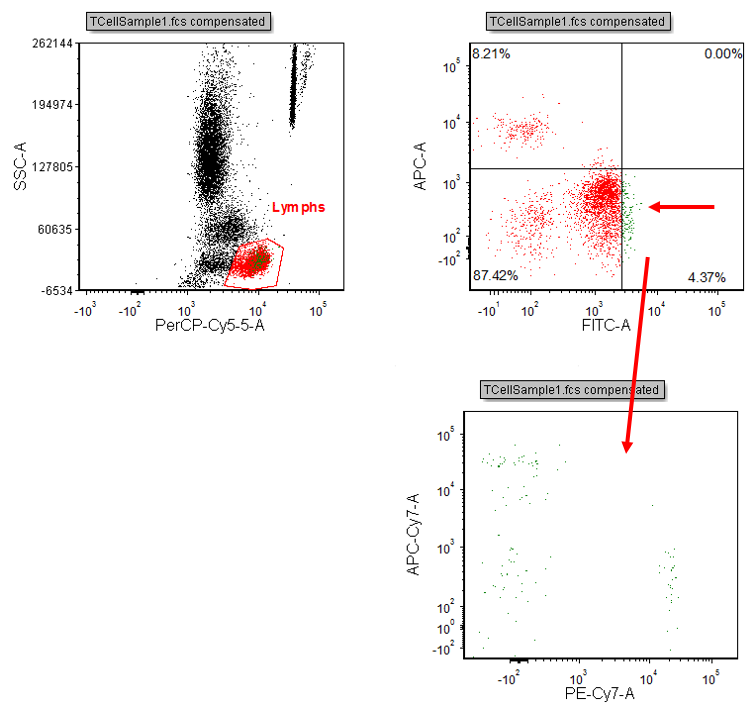
Figure T7.6 GFP(+) Gate Updated after Quadrant Move
15. Select File tab→Close Layout.
In the next section, we will link a marker to a gate.
