Statistic Classifier Tokens
Statistic Classifier tokens allow you to classify a statistic in terms of text. For example, you would use a statistic classifier token to characterize a population as "Positive" or "Negative" depending on the number of cells in a gate or quadrant.
To insert a Statistic Classifier token:
1. Right-click on a Text Box.
2. Select Insert Token from the pop-up menu.
3. Choose the Statistic Classifier category and click on the Insert button. A Create Statistic Classifier dialog will appear.
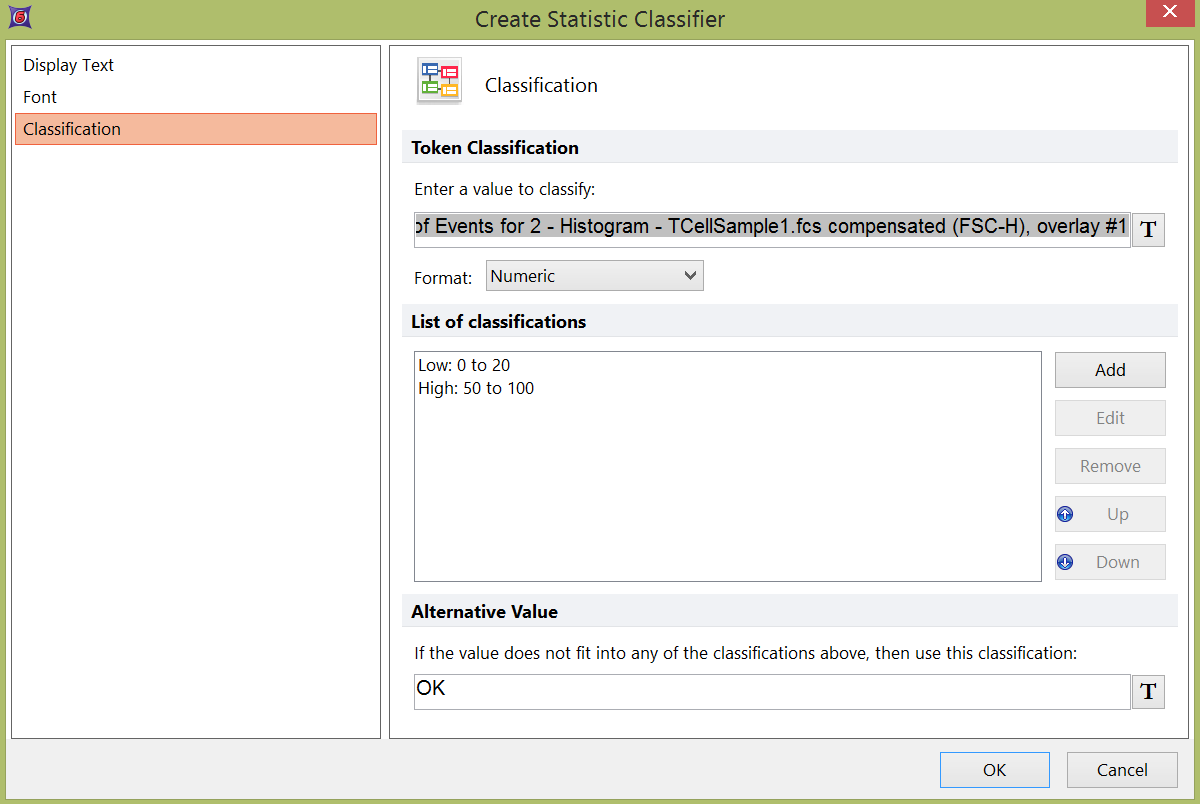
To define the statistic classifier, you enter the value you wish to classify in the Enter a value to classify field. It is possible to enter a formula in this field, similar to a formula you would use for a custom token. Typically, however, you insert a token in this field by clicking on the ![]() button to the right of the field and inserting a Statistic token. FCS Express evaluates the statistic classifier token in terms of the classification that you set in the List of classifications. To Add, Edit, Remove, or reorder classifications, click on the appropriate button to the right of the list.
button to the right of the field and inserting a Statistic token. FCS Express evaluates the statistic classifier token in terms of the classification that you set in the List of classifications. To Add, Edit, Remove, or reorder classifications, click on the appropriate button to the right of the list.
In the example shown in Figure 19.15, a statistic classifier has been based on the percentage of cells in the upper left quadrant of a dot plot. If the percentage of cells in the upper left quadrant is greater than or equal to 30, the fluorochrome marker on the Y-axis of the dot plot is considered to be positive. If the number is less than 30, the population will be considered to be negative for the marker.

Figure 19.15 Statistic Classifier Example
Whenever there is overlap in the classification definitions, FCS Express performs the classification in the order of the entries in the List of classifications. In this example, if the percentage of cells in the upper left quadrant is exactly 30, the population will be considered to be positive because: Positive: 30-100 comes before (i.e., is placed higher than) Negative: 0-30 in the list.
You can also enter a default value for the token if none of the classifications evaluates to true.
Figure 19.16 shows a text box with the statistic classifier from the example. CD19 was displayed on the Y-axis and the percentage of cells in the upper left quadrant was 81.59%.
Figure 19.16 Text Box with Statistic Classifier
