Backgating on a Data Grid
A Data Grid can also be backgated using the formatting options:
1. Right-click on the grid and select Format from the pop-up menu.
2. Choose the Gates to Display category.
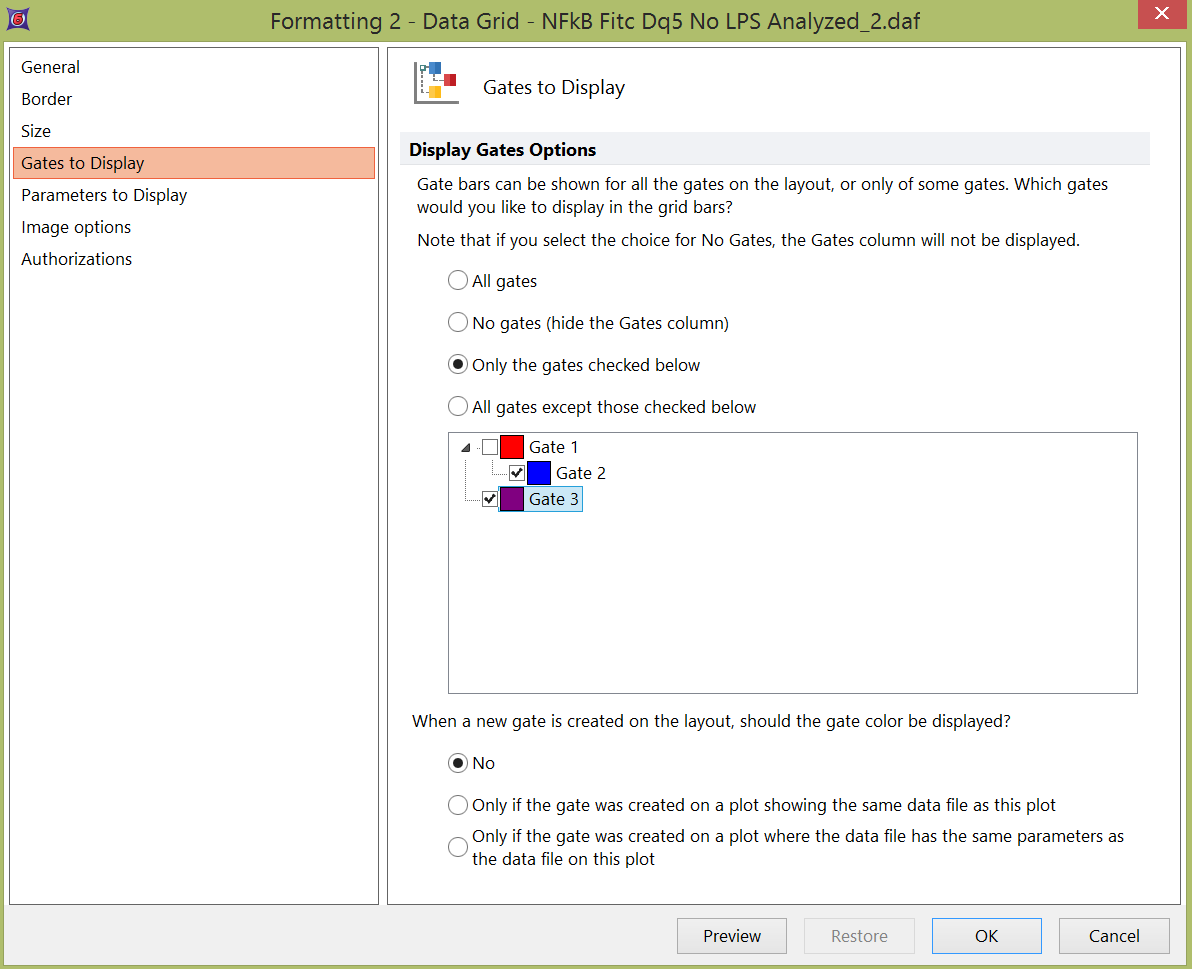
3. Select a gating scheme using the radio buttons and check the gates appropriate to your scheme (Figure 18.3).

Figure 18.3 Formatting a Data Grid - Gates to Display
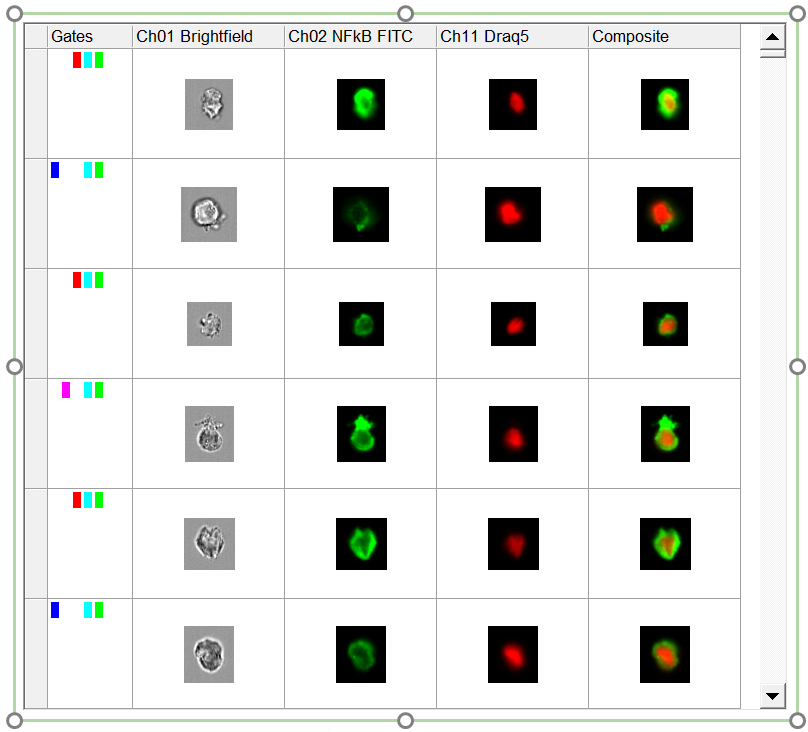
When gates are displayed in a Data Grid, a Gates column is present. If an event falls in one or more gates, colored bars (according to the gate colors) will be shown in the Gates column (Figure 18.4).

Figure 18.4 Backgated Data Grid. Bars in the Gates column of some events show in which gate(s) the cells fall.
