Biexponential Scaling Implementation in FCS Express

Contents
Biexponential Scale Formula
The biexponential scale formula is defined by the equation1:
![]()
Where x is the value in scaled space, while f(x) is the value in linear space.
In order to generate a formula which is valid for all possible real numbers, we reflect the scale formula about w when x < w (Equation 2).
![]()
By definition, ![]() , so we can simplify Equation 2.
, so we can simplify Equation 2.
![]()
For this equation,
•T represents the range of the data in linear space.
•m represents the approximate number of decades of scaled space. For FCS Express, we use the following relation to determine a reasonable value for m:
![]()
•w is the approximate width of the linear data range in scaled space.
oThe limits of values for w are described in the second paper on the scale formula2.
![]()
At w = 0, the linear region of the scale formula is 0, while at w = m/2, the linear region extends for the majority of the data range.
•p is defined by its relationship to w:
![]()
In order to control the width parameter, w, the original paper1 introduced a separate parameter, the “Below zero value”. This value should be equal to the most negative values in the data set.
![]()
In the original paper, the below zero value, R, is always negative. However, in FCS Express, we will display the below zero value as a positive value equal to the absolute value of the paper’s below zero value.
In the second paper describing the biexponential scale formula2, we should pick a value of w which is non-negative. Based on this reasoning, we can limit the values used as the below zero value.
![]()
In a standard 18-bit data file, we have T = 262144 and m = 10.3616. In order to have a non-negative w value, R ≥ 8.2897.
Invalid below zero values:
The graph of the equation that relates w and p is shown below.
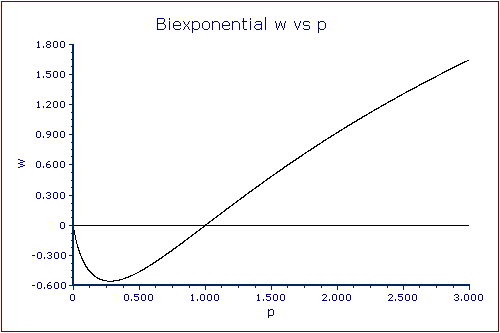
We can see from the graph that if we require w to be positive, then the value of p will be greater than 1. In this graph, we can also see that if we relax the constraint that w is non-negative we can extend the values for w down to a global minimum at w = -0.5569290855... = wmin
Based on the relationship between R and w, we can define the minimum value of the below zero value using the following expression.
![]()
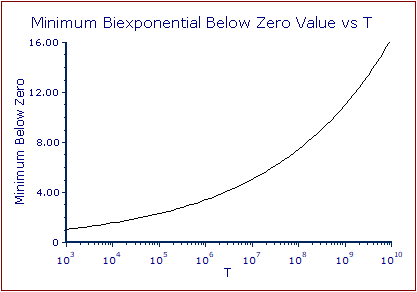
For example, in a standard 18-bit data file, T = 262144, m = 10.3616, and the minimum below zero value will be approximately 2.7214.
A graph of the relation between T and Rmin is shown below.
References:
1.Parks, David R.; Roederer, Mario; Moore, Wayne A. A New ‘‘Logicle’’ Display Method Avoids Deceptive Effects of Logarithmic Scaling for Low Signals and Compensated Data. Cytometry Part A 2006, 69A, 541–551.
2.Moore, Wayne; Parks, David. Update for the Logicle Data Scale Including Operational Code Implementations. Cytometry A 2012, 81(4), 273-277.