Populating a Spreadsheet with data
In this section, we will:
•Insert keyword and statistic tokens into the Spreadsheet.
•Explore various ways of entering information into the Spreadsheet.
We will insert a keyword token in the cells of 'A' column of the HLA Custom Data.fey can be found in the FCS Express Sample Data folder. The keyword $SRC will be used because it has a good description of the sample. In fact, the plot titles are all using the keyword $SRC rather than the filename.
1.Click inside the top cell in the 'A' column, shown highlighted in blue in Figure T15.10.
We are now going to insert the keyword token into the cell. Find the Spreadsheet Tab in the Top Center of the screen, then Click on Layout→Tokens→Insert Token.
2.Click on the Spreadsheet tab→Layout tab→Tokens→Insert Token command, indicated by the red arrow in Figure T15.10.
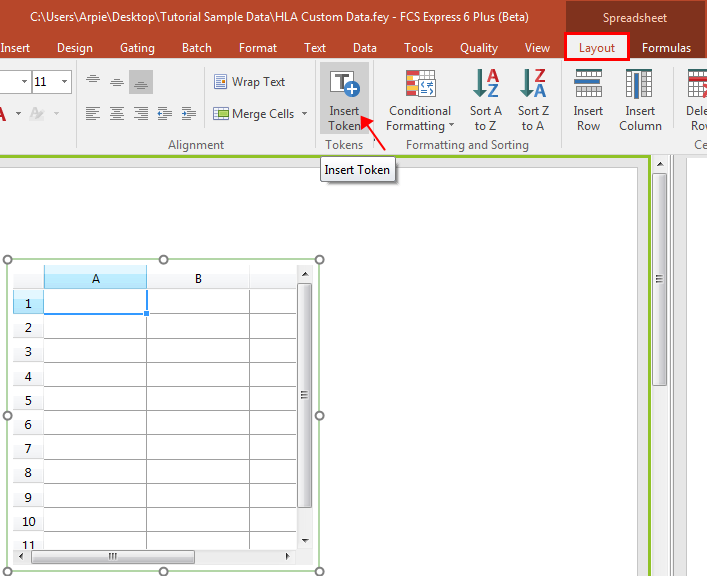
Figure T15.10 Spreadsheet with Insert Token
The Insert a Token dialog appears, as shown in Figure T15.11.
3.Select Keyword.
4.Click Insert.
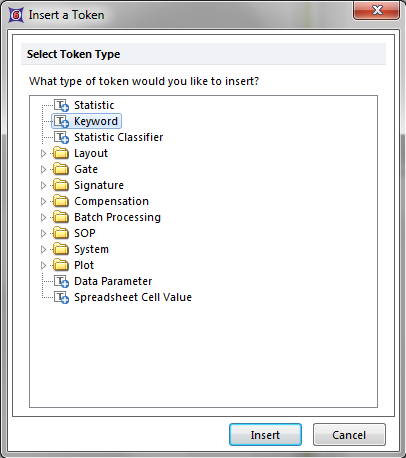
Figure T15.11 Insert a Token Dialog
The Create Keyword dialog appears, with the Data Source category displayed, similar to Figure T15.12.
5.Select any of the plots associated with the data file XM110210-201.001 (PBS NEGATIVE CONTROL), shown highlighted in blue in Figure T15.12.
6.Select the Keyword category on the left.
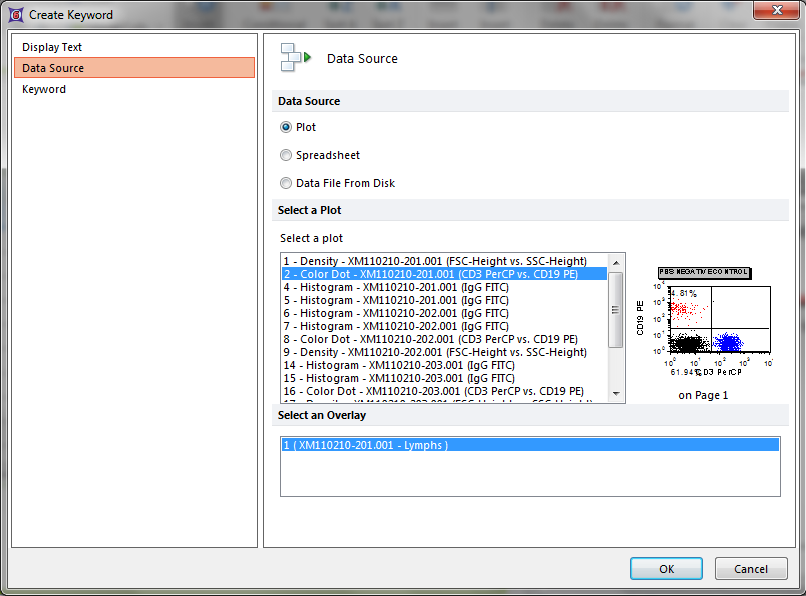
Figure T15.12 Create Keyword Dialog
The Keyword category of the Create Keyword dialog appears, similar to Figure T15.13.
7.Type '$SRC' in the Select a keyword text field.
8.Click OK.
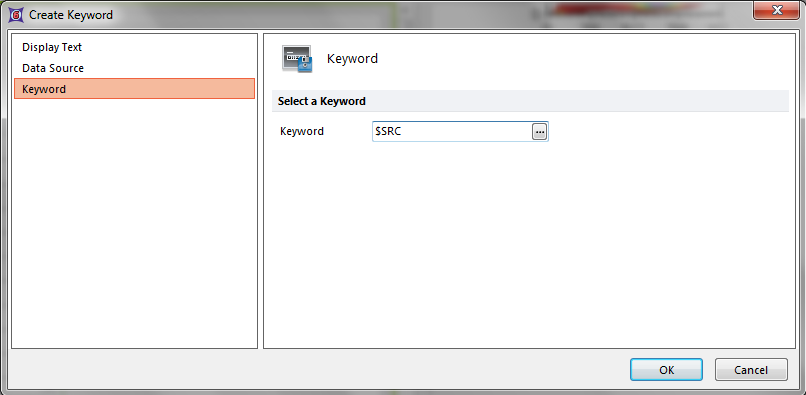
Figure T15.13 Create Keyword Dialog -- Keyword Category
Alternatively, click on the ellipsis icon, indicated by the cursor in Figure T15.13. The Please select a keyword dialog appears, as shown in Figure T15.14.
•Scroll down and select $SRC, shown highlighted in blue in Figure T15.14.
•Click OK.
•Click OK in the Create Keyword dialog.
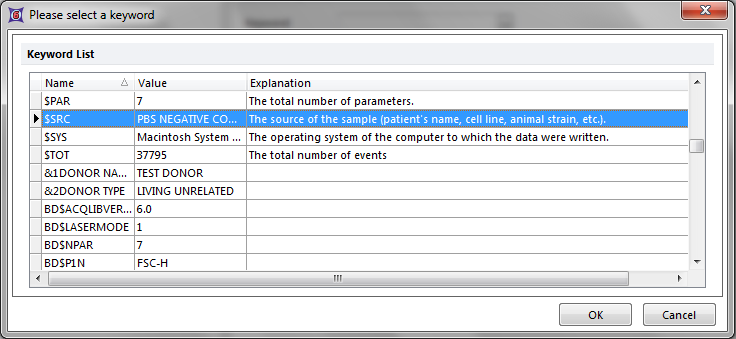
Figure T15.14 Please Select a Keyword Dialog
The Spreadsheet updates to reflect the insertion of the keyword in the 'A1' cell.
We will now fill in the rest of the 'A' Column. However, rather than repeating all the previous steps, we will simply drag and drop the appropriate plot onto the correct cell in the data grid.
10. Place the cursor over one of the 'AB HUMAN NEGATIVE SERUM ' 2D plots from page 1, shown highlighted in red in Figure T15.16.
11. Press and hold the left mouse button and drag the plot towards the Spreadsheet, as shown in Figure T15.16.
12. Release the left button when the plot is over the second cell of the A column, indicated by the cursor in Figure T15.16.
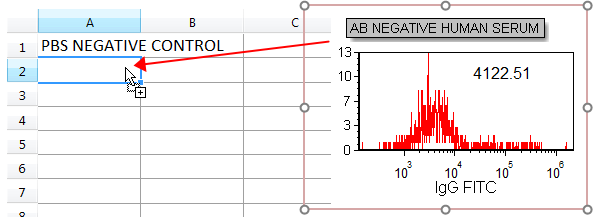
Figre T15.16 Dragging and Dropping the AB NEGATIVE HUMAN SERUM Plot onto the Spreadsheet
The Paste Special dialog appears, similar to Figure T15.17.
13. Select Keyword token, shown highlighted in blue in Figure T15.17.
14. Click OK.
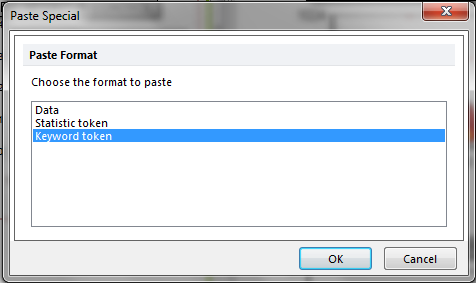
Figure T15.17 Paste Special Dialog
The Edit Keyword dialog appears, similar to the Keyword category of the Create Keyword dialog previously shown in Figure T15.13.
15. Type '$SRC' in the Select a keyword text field.
16. Click OK.
Note: Dragging a plot onto a place in your layout that can accept a token is a very convenient way of creating that token, since you do not have to manually select the data source for the token like you did in step 5 above.
The second cell of the A column updates to reflect the addition of the keyword for the AB NEGATIVE HUMAN SERUM plot. We will now fill the rest of the cells in the A column.
17. Repeat steps 10 through 16 for the third cell in the A column using a POSITIVE SERUM plot from page 2.
For the 4th cell in the A column, we will manually type in the sample information.
18. Type 'PATIENT SERUM'.
Alternatively, you can click anywhere outside the Spreadsheet to accept the entry into that particular cell. If you do not wish to save the data typed in the editor, you can select the Delete icon, or hit Esc on the keyboard and the changes will be canceled.
The Sample column of the Spreadsheet is now filled in and should appear similar to Figure T15.20.
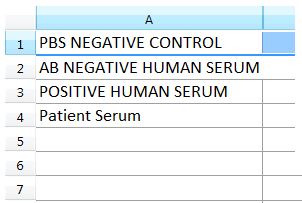
Figure T15.20 Sample Column Completed
We will now insert the 'B' column as the results of the 'Bcell Median', and the 'C' Column as the results of 'Tcell Median' column values as token statistics. Because these median values are already being displayed as tokens in the histograms, we will simply copy and paste these tokens into the appropriate cells of the 'B' and 'C' columns.
19. Place the cursor at the beginning of the B-Cell token value in the PBS NEGATIVE CONTROL histogram (page 1), shown in red on the layout.
20. Select the B-Cell token text. You will know it is selected because the text will be white, indicated by the cursor in Figure T15.21.
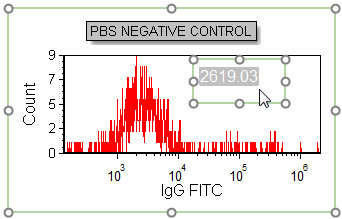
Figure T15.21 Token Value Selected
23. Copy the text using Cmd+C on the keyboard.
Alternatively, after Step 21, the B-cell token text can be copied using the pop-up menu.
•Right click to bring up the pop-up menu.
•Select Copy from the pop-up menu, shown highlighted and indicated by the cursor in Figure T15.22.
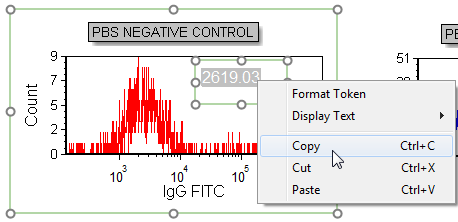
Figure T15.22 Copying a Token Using the Pop-up Menu
We will now paste the B-cell token into the appropriate cell of the 'B' column of the Spreadsheet.
24. Click inside the first cell of the 'B' column to select it.
25. Paste the text using Cmd+V on the keyboard.
26. Click anywhere outside the Spreadsheet to accept the entry.
Alternatively, after Step 24, the token text can be pasted using the pop-up menu.
•Right-click inside the first cell of the 'B' column to bring up the pop-up menu.
•Select Paste Text from the pop-up menu.
•Click anywhere outside the Spreadsheet to accept the entry.
The rest of the 'B' column can now be filled using copying and pasting by repeating Steps 20 through 26 using the B-cell histograms of the AB NEGATIVE HUMAN SERUM, POSITIVE SERUM, and PATIENT SERUM. The 'C' column of the Data Grid can be filled in by copying the token median text displayed in the T-cell histograms, shown in blue on the layout. Again, repeat Steps 20 through 26, substituting the T-cell tokens for the B-cell tokens. All the cells of the 'B' and 'C' columns of the Spreadsheet should be filled in and appear similar to Figure T15.23.
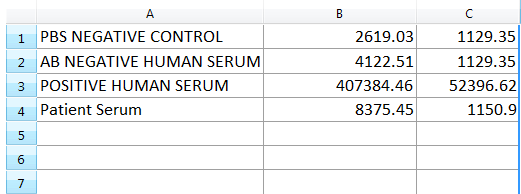
Figure T15.23 Spreadsheet with B- and T-Cell Median Values, in Column B and Column C, Respectively
In the next section, we will create and use custom tokens in a spreadsheet.
