Data Display
The axis scale for a given plot can be adjusted using the axis formatting options. All data files, regardless of the scale that they were acquired with, can be displayed in any of the scalings supported by FCS Express. The scaling only affects the display of the data, not the statistics.
Lin/Log and Hyperlog scalings:
The Lin/Log and Hyperlog scalings both a have coefficient that can be adjusted. The coefficient can be changed in the Scale section of the Axis page in the formatting dialog (right-click on the plot, select Format from the pop-up menu). The coefficient is called the Transition Point because it describes the transition from the predominantly linear to predominantly log portion of the transform. The transition parameter for the Hyperlog scaling is identical to the b parameter in the Bagwell paper.
An example of setting the Lin/Log scaling with a Transition Point of 200 is shown in Figure 9.62. Transition values are entered in channel units, and do not have to be scaled as described in the Bagwell paper.
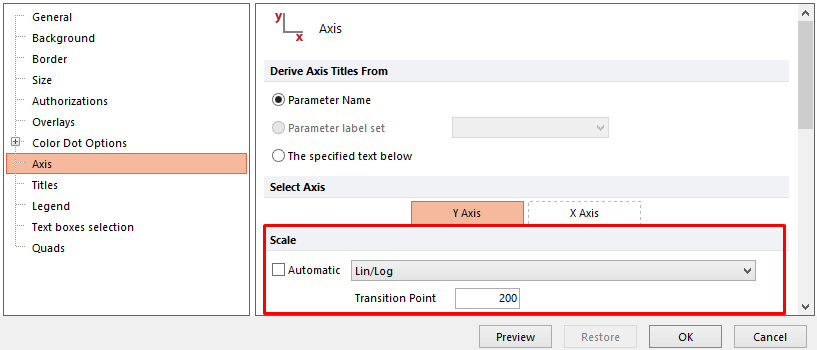
Figure 9.62 Setting the Transition Point for the Y-axis in Lin/Log Scaling
For any of these transforms, smaller transitions values result in plots which more closely resemble the standard log plots. The precise transition value to use will depend for the most part on your data, and generally a value of at least 30 is required.
The biexponential display was popularized by the BD FACSDiva software. As a result of our close collaboration with BD, FCS Express now supports all of the options that FACSDiva does in terms of displaying biexponential data. In fact, we have implemented FACSDiva's proprietary algorithm for calculating the transition (Below-zero) value, so the results from FCS Express will look identical to the results from the FACSDiva software.
When an FCS file that was acquired with BD FACSDiva is opened in FCS Express you will notice that the automatic scaling in FCS Express applies the Biexponential scaling and chooses the Below Zero Parameter (transition point) automatically (Figure 9.63).
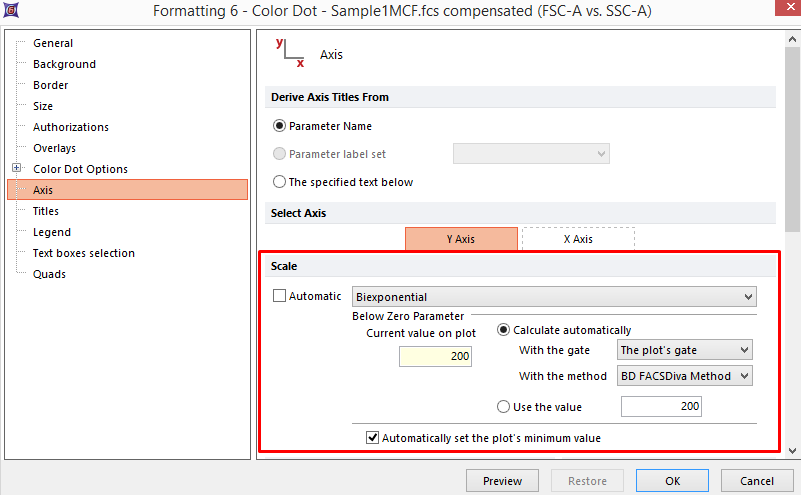
Figure 9.63 Automatic biexponential scaling in FCS Express of a file acquired in BD FACSDiva.
The Below Zero Parameter can also be manually adjusted by unchecking the Automatic box and selecting the Use the value radio button. You may also choose to Automatically set the plot's minimum value by checking/unchecking the associated box. When the Automatically set the plot's minimum value is checked the axis minimum is set to optimize the display by not displaying outliers. When unchecked the entire range of data, including outliers, will be displayed (Figure 9.64).
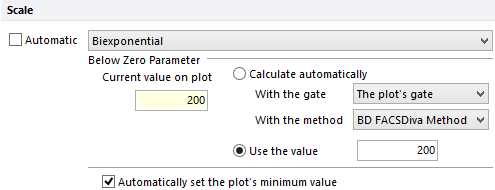
Figure 9.64 Manually entering a Below Zero Parameter value with Biexponential scaling.
The Calculate automatically radio button may also be checked if you would like to change the gate for calculating the display (Figure 9.65) or if you would like to change the method for calculation to 5th percentile (Figure 9.66). The Fifth percentile method sets the plots minimum such that the bottom 5% of the data within the selected gate is not visible.
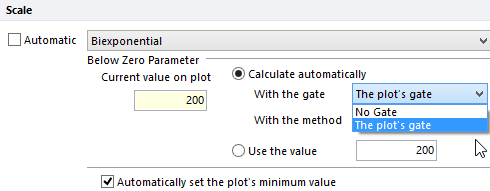
Figure 9.65 Choosing a gate for calculating the biexponential display.
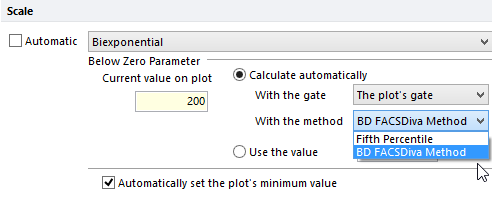
Figure 9.66 Choosing the BD FACSDiva Method or the Fifth Percentile method for display.
ArcSinh is an inverse hyperbolic function most widely used with .fcs files generated by CyTOF Mass Cytometry. Unlike standard light based flow cytometry, mass cytometry can produce many true zero signal ("intensity") values. An ArcSinh transformation helps display and visualize values at or near zero with a "spread" as we are accustomed to visualizing with standard flow cytometry data. ArcSinh values are calculated by applying the ArcSinh equation to the raw intensity value and dividing by a cofactor. The "cofactor" defines the size of the linear region around 0, with larger cofactors corresponding to a longer linear region. (Figure 9.67).

Figure 9.67 - The formula for converting to Archsinh scaling.
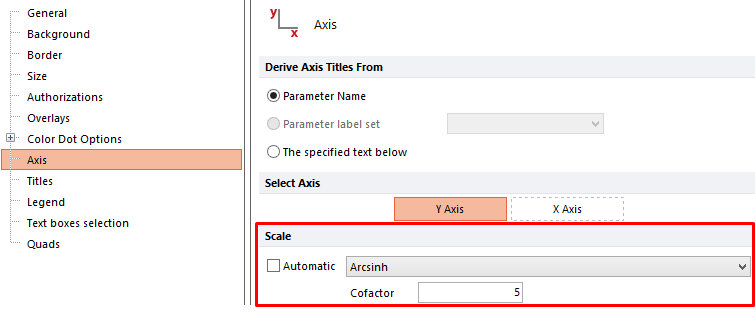
Figure 9.68 - Arcsinh is choosen from the Scale drop down menu. The cofactor value determines the size of the linear region around 0.
