Editing a Compensation Definition
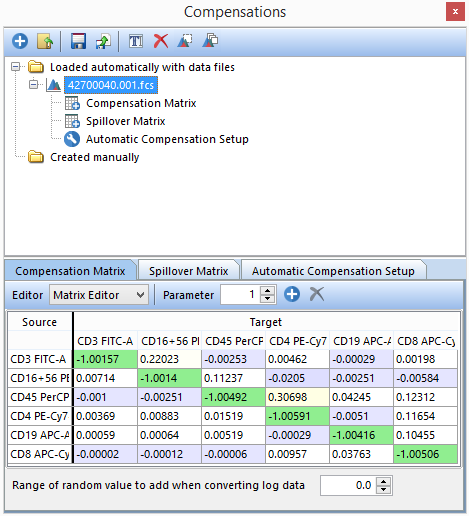
Selecting a file within the Compensations navigator displays the compensation definition in the tabs below. Expanding the compensation file node will reveal the Compensation Matrix, Spillover Matrix, and Automatic Compensation Setup items. Clicking on items in the expanded view is just like choosing the different tabs in the lower pane of the window (Figure 16.5).
FCS Express has color-coding for values in compensation and spillover matrices. The color heat map allows users quick identification of same parameter pairings (green) and potentially high (shades of yellow to red) or low (shades of purple to blue) values.
You can choose to view the Matrix Editor or List Editor from the Editor drop-down to view a matrix of Source vs. Target or to view a list of Target - % Source, respectively.

Figure 16.5 The Compensations Navigator displaying the Compensation Matrix in Matrix Editor View.
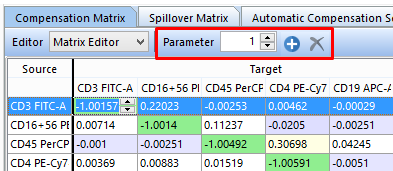
Compensations can be edited directly from the Compensation Matrix tab and Spillover Matrix tab by clicking on the Target (Matrix Editor) (Figure 16.6, left) or Value (List Editor) (Figure 16 below and right) and using the up and down arrows (outlined in red below) or entering a value to adjust the compensation.

Figure 16.6 Adjusting compensation values using the compensation Matrix (left) and List (right) Editors. Use the up and down arrows or manually enter a value to adjust the compensation.
Every compensation must be given a unique name. The name of your compensation may be changed at any time by selecting the compensation and clicking the Rename selected compensation button ![]() or by right-clicking on a compensation and choosing Rename. You may find it helpful to enter the date or experiment number as the compensation name.
or by right-clicking on a compensation and choosing Rename. You may find it helpful to enter the date or experiment number as the compensation name.
The Parameter field allows you to add or remove parameters to/from the matrix by clicking the ![]() or
or ![]() buttons (Figure 16.7).
buttons (Figure 16.7).

Figure 16.7 The Parameter field allows you to add or remove parameters to your compensation matrix.
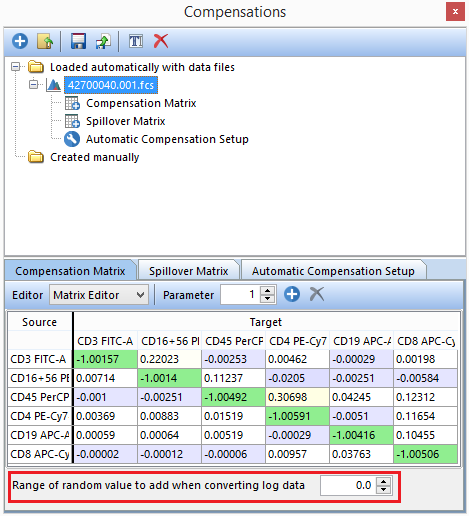
Compensation must be performed on linear data. If you have stored data on a logarithmic scale in your FCS file (common with FCS 2.0 data files), this data has to be converted to a linear scale before compensation is applied. It is then converted back to log for display. Depending on the resolution of your original file, this can result in digitization errors, which can cause large numbers of events to group in a single channel. The conversion to linear and reconversion back to log occurs automatically during the software compensation process. However, if you notice digitization errors, you can enter a value to spread the grouped population out using the Range of random value to add when converting log data field (Figure 16.8). Typically, this value should be less than one. This will add a small random value to the linear value prior to it being reconverted back to log. It is recommended to leave this value at zero unless these digitization errors become apparent.

Figure 16.8 The Range of random value to add when converting log data field allows you to easily correct for digitization errors.
