Formatting the Legend

Contents
Legends are useful to describe the data presented in your plots and to help distinguish between several data files that are overlaid onto a single plot.
In the course of this example, we will:
•Learn how to add an overlay to a histogram.
•Acquire an overview of legend formatting.
•Change the legend font.
•Change the legend position.
In order to format the legend, we will first create a histogram with an overlay.
1.Insert a histogram using the data file ApoMono.001. If you do not know how to insert a histogram, see the Inserting Plots chapter of this tutorial.
2.Right-click on the histogram.
3.Select Add Overlay from the pop-up menu.
4.Choose the ApoMono.002 data file. Leave the rest of the properties on the add overlay window alone.
5.Press OK to add the overlay.
The histogram should look like Figure T3.24. If the legend is already on your plot, your preferences may be set to automatically add legends.

Figure T3.24 Histogram with Two Overlays
To format the legend:
1.Right-click on the histogram and select Format from the pop-up menu. The Formatting window appears (Figure T3.25)
2.Select the Legend category on the left (![]() ).
).
3.Check the Visible checkbox (![]() ) (if it is not already checked).
) (if it is not already checked).
4.Press the Font button (![]() ) and change the font to Times New Roman, 10 pt, Bold.
) and change the font to Times New Roman, 10 pt, Bold.
5.Press OK on the font dialog to accept the changes.
6.Change the Position (![]() ) to "Top".
) to "Top".
7.Press OK to accept your changes.
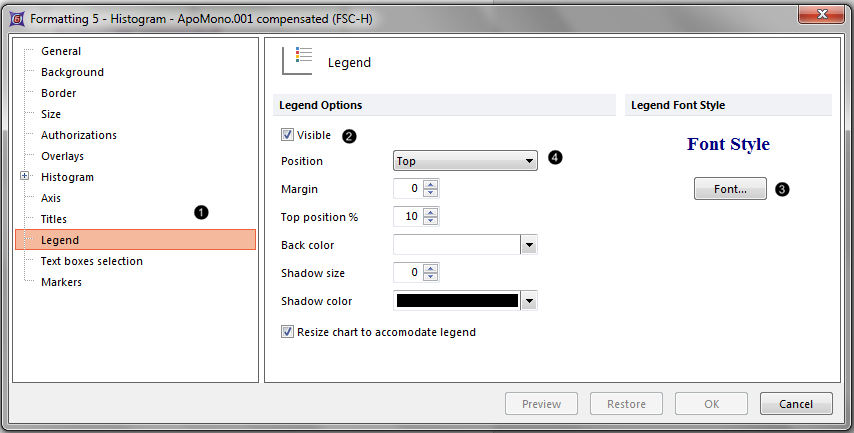
Figure T3.25 Formatting - Legend Category
The plot should now look like Figure T3.26.

Figure T3.26 Histogram with Formatted Legend
Overlays can be formatted either as stacked or overlaid.