Inserting Proliferation Plots
A proliferation plot can be created just like any other plot in FCS Express, and regular histograms can easily be changed to a proliferation plot.
In the course of this section we will:
•Insert a new proliferation plot
•Change a histogram to a proliferation plot
1. Open the "Proliferation Tutorial Fitting Proliferation Cells Section.fey" layout in the Proliferation Tutorial folder within the Tutorial Sample Data folder.
2. Click on the Proliferation Data page tab.
3. Click on the Insert Tab→1D Plots→Proliferation button (Fig. T20.1).

Figure T20.1 Inserting a Proliferation Plot
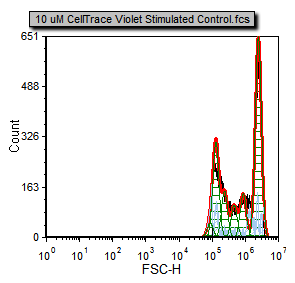
4.Click below the current proliferation plot to insert a new proliferation plot. The plot will look like figure T20.2a and we must change the X Axis parameter and gate to display the data correctly.
 Figure T20.2a Proliferation plot before formatting the X Axis parameter and applying the Sytox gate. |
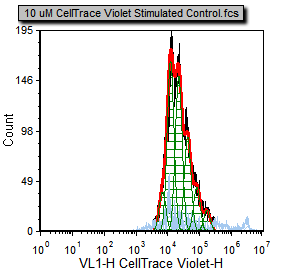
 Figure T20.2b Proliferation plot after formatting the X Axis parameter and applying the Sytox gate. |
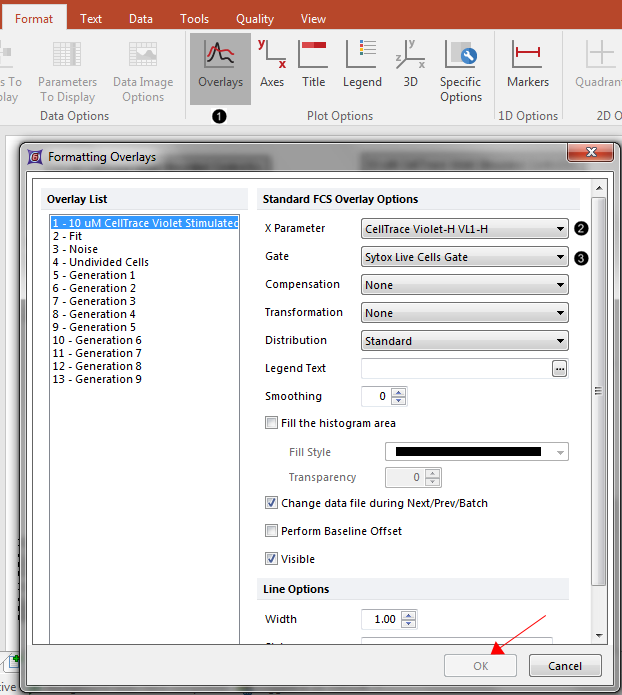
5.Choose the Format tab from the ribbon→Plot Options→Overlays (Fig. T20.3, ![]() ).
).

Figure T20.3 Formatting overlay options on a proliferation plot.
6. Change the X Parameter to CellTrace Violet-H (Fig. T20.3, ![]() ).
).
7.Change the Gate to Sytox Live Cells Gate (Fig. T20.3, ![]() ).
).
8. Click OK (Fig. T20.3, mouse pointer).
The proliferation plot for the sample is now present on the page and has been formatted to display the correct parameters and gates (Figure T20.2b).
We will now change the histogram on the Gating page to a proliferation plot.
9. Click on the Gating page tab at the bottom of the program to make the Gating page visible.
10. Click on the histogram labeled Proliferation Histogram in the title, located towards the bottom of the Gating page, to select it.
11. Click on the Format tab→Change→Change Plot Type button.
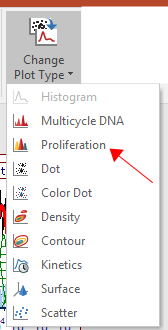
12. Select Proliferation from the drop down menu (Figure T20.4).

Figure T20.4 Changing plot type from a histogram to a proliferation plot.
You will now notice that the histogram has been changed to a proliferation plot that is ready for analysis.
The Inserting Proliferation Plots section is now complete. Please close the layout and do not save the changes before proceeding to the next section.
In the next section we will learn how to further modify the default fit for use with the data.
