Showing the Concentration in a Statistics Window
In the course of this example, we will:
•Set up the concentration calculator for displaying the results in the layout using beads or time and flow rate.
•Show the concentration calculated as a statistic in a statistics window.
We have learned how to obtain one-time calculations of the cell concentration in a sample. We will now learn how to present these results in the layout using the statistics window.
1.Right-click in the forward vs. side scatter plot containing the Beads1 and Monocytes gates to bring up the associated pop-up menu.
2.Select Statistics→Gate Statistics from the pop-up menu.
A Gate Statistics window should appear (Figure T22.6). Move it to a convenient place in the layout.

Figure T22.6 Statistics Window
3.Click once on the statistics window to select it; it should have a green border (Figure T22.6).
4.Select the Format→Statistics Options→Statistics command (Figure T22.7).

Figure T22.7 Selecting Format Statistics Command
The Formatting Statistics dialog now appears (Figure T22.8). We are now going to select which statistics to display in the statistics window on the layout.
5.Select only the following items on the Formatting Statistics dialog (Figure T22.8):
•Gate![]()
•Number of Events![]()
•% of Gated Cells![]()
•% of All Cells![]()
•Concentration![]()
6.Click OK to close the Formatting Statistics dialog.
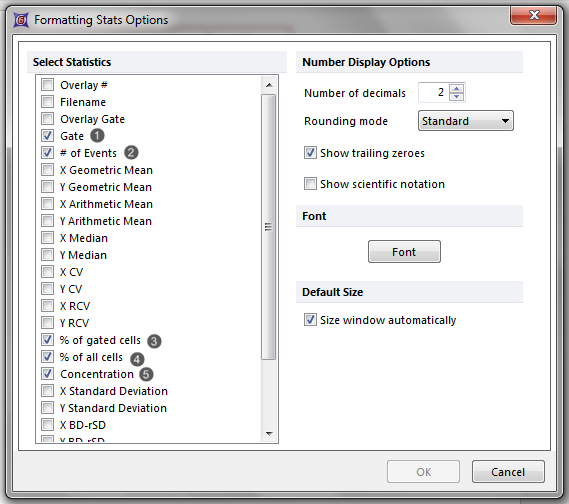
Figure T22.8 Formatting Statistics Dialog
The statistics window will now appear as shown in Figure T22.9 displaying only the items selected in the Formatting Statistics dialog.
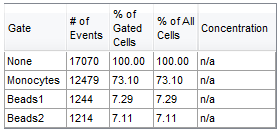
Figure T22.9 Statistics Window after Formatting
There are two other ways to format the statistics window to show only the statistics you want:
•Choosing the statistics to be displayed using the statistics window pop-up menu:
A.Right-click on the statistics window to bring up the associated pop-up menu (Figure T22.9).
B.Left-click on the individual statistics you want displayed.
C.Left-click on the items you want removed (Figure T22.10).

Figure T22.10 Statistics Window Pop-up Menu
•Choosing the statistics to be displayed using the statistics window Format dialog:
A.Right-click on the statistics window to bring up the associated pop-up menu (Figure T22.10).
B.Select Format from the pop-up menu.
C.Select the Stats category from the left panel of the Format dialog (Figure T22.11).
D.Set the statistics you want displayed and then click OK (Figure T22.11).
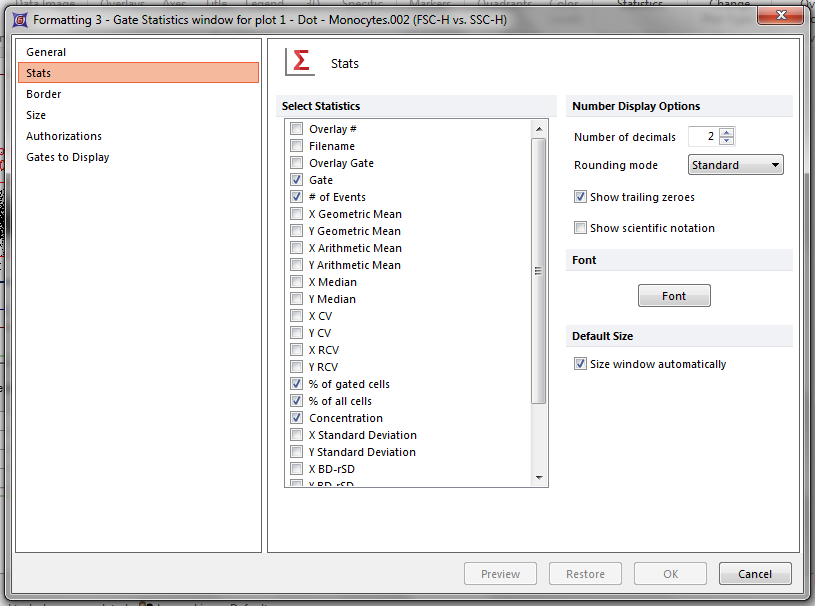
Figure T22.11 Stats Category of the Statistics Window Format Dialog
As you can see in Figure T22.9, the statistics window has a Concentration column, but it is undefined and shows only n/a. We will now setup FCS Express to calculate these concentrations.
7.Select the View→Tools→Concentration Calculator command (Figure T22.2).
The Concentration Calculator dialog appears as previously shown in Figure T22.4.
8.Click on the second tab titled Stats Window Setup (Figure T22.12).
As before, there are two ways to do this: a) specifying a beads gate and giving the concentration of the beads in the sample, or b) using time together with the sample's flow rate when acquired. We are going to specify the Reference Beads as shown in Figure T22.12.
9. Select the Reference Beads radio button.
10. Select Beads2 in the Bead Gate drop-down list.
11. Enter 100000 in the Bead Concentration field.
12. Click OK (Figure T22.12).
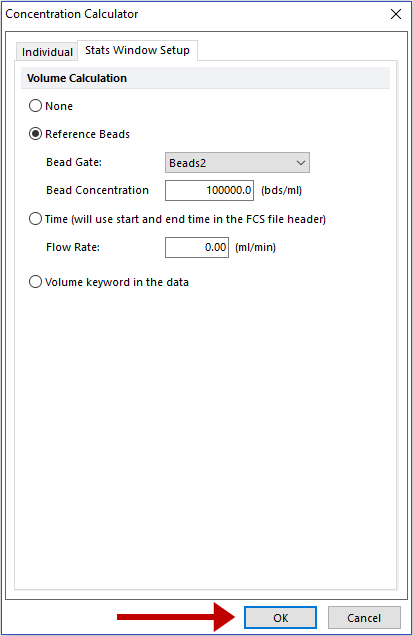
Figure T22.12 Concentration Calculator Dialog -- Stats Window Setup
Now, the statistics window will show the results in the Concentration column for every gate in the plot using the parameters you specified in the previous step (Figure T22.13). This setup will apply to the whole layout and will be used for the concentration statistics of every plot in the layout.
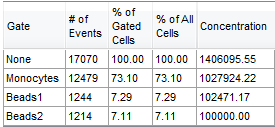
Figure T22.13 Statistics Window with Concentration Results by Gate
Now, we will show the concentration as a token.
