The Fit Parameters Option
If the algorithm finds a significant population of events that it determines to be noise (shown in Light Blue on the Proliferation histogram), you can try to modify the Proliferation Fit Parameters in order to attempt to improve the model's fit.
To format the fit parameters of a Proliferation histogram:
1. Right-click on the Proliferation histogram and choose Format from the pop-up menu.
2. Click on the triangle next to Proliferation to expand the category.
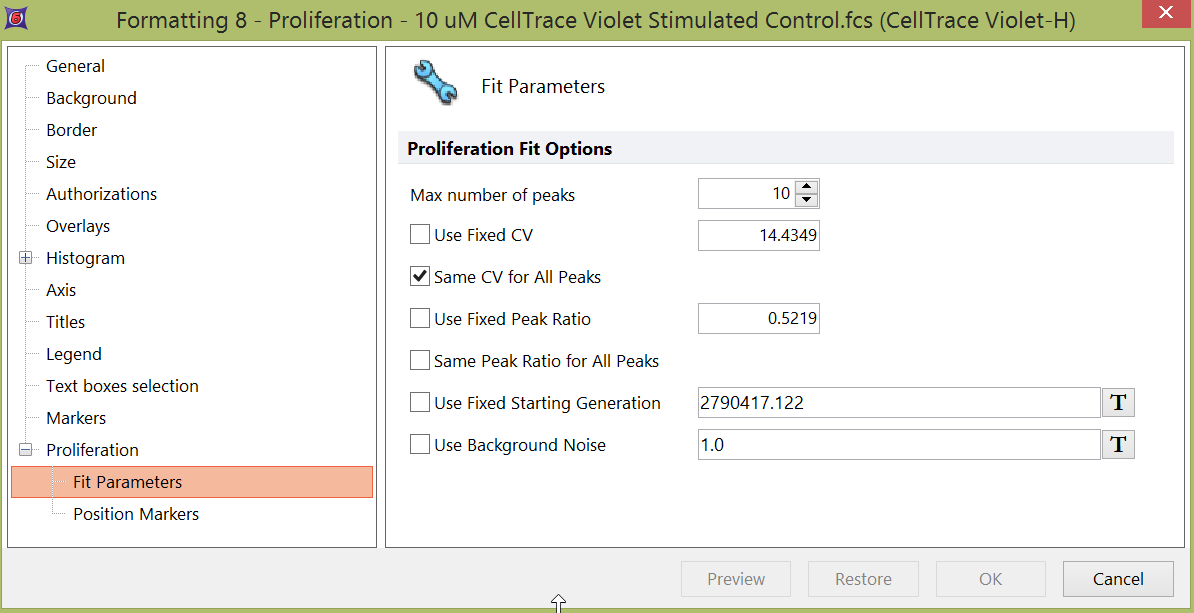
3. To change the fit model, select the Fit Parameters category (Figure 26.2).

Figure 26.2 Formatting Proliferation Fit Parameters
On the Fit Parameters page, you can modify a number of properties related to the fit algorithm, including:
•Maximum number of peaks to model.
•Fixed CV. Decide whether or not to use a fixed CV (defined by the user) for all peaks. Note that, the value defined in the Fixed CV field is actually interpreted by the software as the Standard Deviation of the peaks, calculated, on log-transformed values, after binning.
•Same CV for All Peaks. When this option is selected, the CV, calculated on linear-scaled data (i.e. raw data), is made the same between peaks. Note that the CV reported in the Proliferation Statistics table, is calculated on the log-scaled data instead.
•Fixed Peak Ratio and/or Same Peak Ratio for All Peaks.
•Fixed Starting Generation
•Background Noise. The values defined in this field is subtracted from the channel values prior to doing any fitting.
The following is a brief description of how the fitting algorithm works, which will help you to set the properties:
•The fitting process starts by determining where the population of cells that have not divided is located. The fitting process attempts to find this peak automatically, although you can specify it manually. In some cases, you have to specify it manually since there are no cells in the population that have not divided.
•Once the undivided population is found, the model attempts to find populations that have decreased in fluorescence by 50% from each other. Since not all experiments work according to theory, the model starts looking at the 50% point but can move left or right to find the true peak. You can control this by using the Same Peak Ratio for All Peaks option.
•In order to find a peak, the model makes certain assumptions about the width of each peak compared to the undivided control. You can also control these settings using the Same CV for All Peaks option. When this options is selected, the CV, calculated on linear-scaled data (i.e. row data), is made the same between peaks.
•The model can also subtract background fluorescence from all the calculations, if you provide a value for the background fluorescence.
•Since the algorithm uses the actual histogram contour to model the fit, the histogram data should not be smoothed. Only in special cases, when the original data is very noisy, should a little smoothing be applied to allow the model to better fit the data.
•These options exist in order to accommodate the wide range of data sources and biological behaviors that the model has to encompass. Thus, in order to obtain the best fit, it is important that the correct initial settings be selected. In practice, this is usually performed by trial and error until the settings providing the best fit are found.
•The two ways to assess the goodness of the fit are visual inspection, which gives a rough measure, and the proliferation fit statistics.
