Using Quadrants
FCS Express supports three different kinds of Quadrants: Standard, Floating, and Percentile. The four quadrants are defined as follows: Upper Left (UL), Upper Right (UR), Lower Left (LL), and Lower Right (LR).
Standard quadrants are the quadrants found in most flow cytometry software packages. All four quadrants are square or rectangular and are defined by the central vertex. Moving the central vertex of the quadrants will redefine all four quadrants.
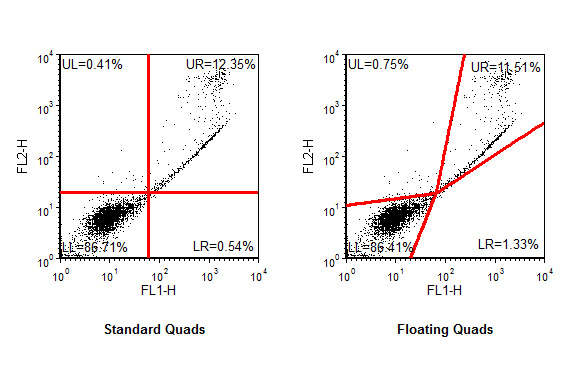
Floating quadrants allow the four quadrants to be non-rectangular. When the quadrants are floating, each quadrant can have a different shape. The outer vertices are no longer linked to the central vertex, and each vertex can be manipulated individually (see Floating Quads example, below). Floating quadrants allow the user to quickly and easily get statistics on populations that cannot be demarcated by standard quadrants. This can eliminate the need for compensation when only percentages are needed.
Examples of Standard Quadrants and Floating Quadrants are shown in Figure 9.44.

Figure 9.44 Standard vs Floating Quads
Percentile Quadrants are similar to standard quadrants except that the vertex of the quadrant is automatically calculated based on the percentile entered in the Quads page of the Format dialog. The vertices of the quadrants will automatically update as the data on the plot changes. For instance, if you set the percentile to be 99%, the quads will automatically update so the center quadrant vertex is at the channel where 99% of the events are below it. It can be useful to set Percentile Quadrants on your controls and then link those quadrants to the plots with your sample. Quad linking is described in the section on Linking Quadrants to Quadrants.
