3D Display Options
Even though only surface plots have typically been displayed in three dimensions (3D), FCS Express also has the capability of rendering histograms in 3D. The appearance of histograms with multiple, filled-in overlays may be enhanced in 3D.
The 3D display options control the 3D plot appearance and orientation relative to the user. You can edit the 3D display options for a surface plot or histogram in one of two ways:
•Select the plot(s) and use the Format tab→Plot Options→3D command.
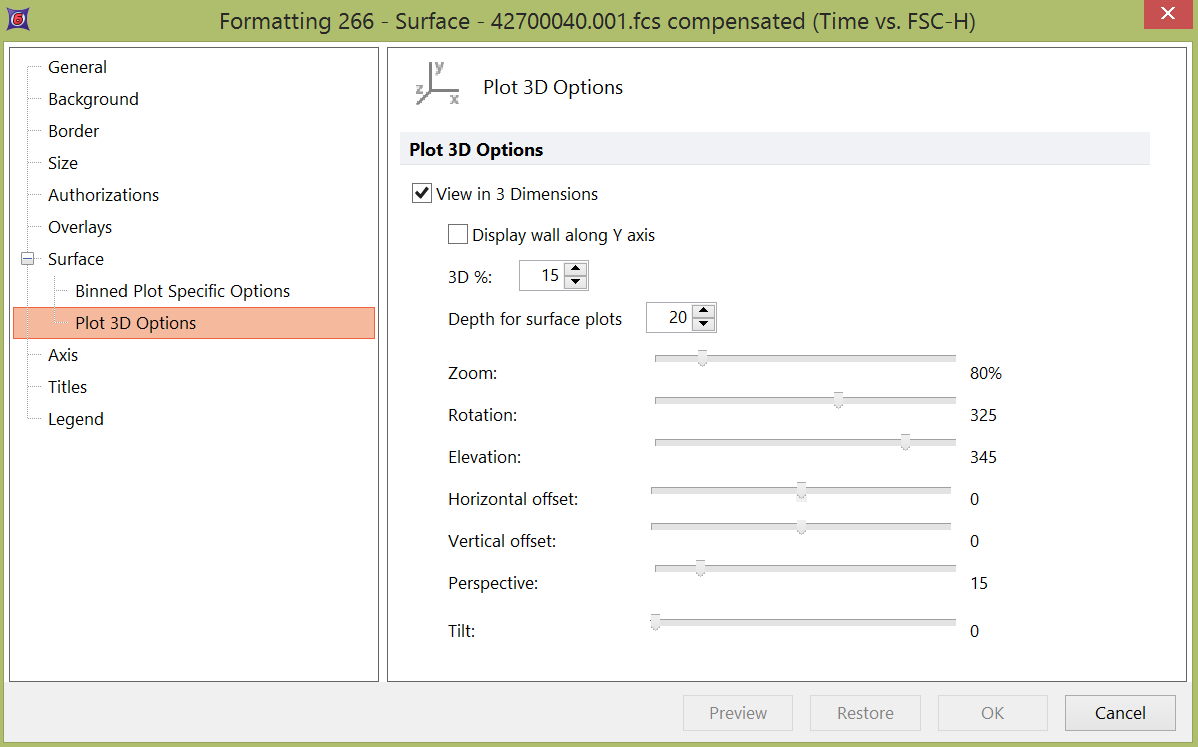
•Right-click on the plot, select Format from the pop-up menu, and choose the Surface→Plot 3D Options or Histogram→Plot 3D Options category, as appropriate (Figure 8.75).
Note: Previewing changes several times without saving is an effective method of becoming familiar with the 3D controls. Right-clicking on the plot and selecting the appropriate 3D Options page has the advantage of bringing up a dialog with Preview and Restore buttons.

Figure 8.75 Formatting 3D Options for a Surface Plot
Check or uncheck View in 3 Dimensions to toggle 3D on or off.
Use the Display wall along Y-axis check box to turn on or off a yellow wall along the Y-axis.
Depth can be controlled (from 0% to 100%) with the 3D% (for histograms) or the Depth for surface plots spin buttons. As 3D% increases, the third dimension z-axis widens and the single-plane events progress from dots to short stubble to long lines.
The other options are controlled by sliders:
•Zoom resizes the plot within the object border from less than 100% (smaller than current size) to 500%. As the zoom % increases, axes and events may extend beyond the object border until the zoom is decreased again. The zoom is reversible, i.e., no data is lost.
•Rotation pivots the plot on the vertical axis from 270 to 360 where 360 is facing the user straight on and 270 rotates the plot clockwise (turns a 90-degree pivot to the left), so the right-hand z-axis is facing the user straight on.
•Elevation turns the plot on the horizontal axis from 270 to 360 where 360 is facing the user straight on and 270 tips the top edge of the plot forward (turns a 90-degree pivot down), so the top edge z-axis is facing the user straight on.
•Horizontal offset and Vertical offset control the position of the 3D plot on the page.
•Perspective is a value from 0-100 that controls how far the chart appears to be from the user.
•Tilt is a value from 0-360, indicating the number of degrees the plot will be rotated in its 2D-space about an axis perpendicular to the screen.
