Applying Gates

Contents
In the examples above, we created several gates. We will now learn how to apply them to a plot.
In the course of this example we will:
•Apply a gate from the format screen.
•Apply a gate from the Gating tab.
•Apply a gate from the Gate Navigator.
We will continue using the layout we have been using until now. Numbers refer to Figure T4.21.
1.Right-click on the plot that used to have the "Whole Cells" gate on it.
2.Select Format from the pop-up menu.
3.Select the Overlays Category ![]() .
.
4.Change the Gate ![]() to "Cells in ellipse".
to "Cells in ellipse".
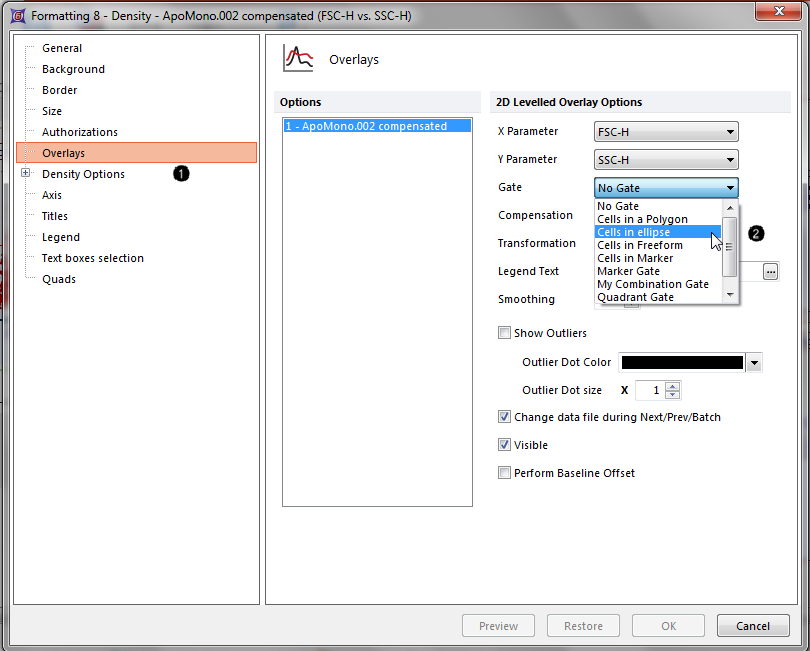
Figure T4.21 Formatting 2D Plots (Overlays Category)
5.Press the OK button to accept the change.
The plot should now look similar to the right panel of Figure T4.22.
Note: The plot may not look exactly like Figure T4.22 because you may have placed your ellipse gate in a slightly different position.
 become gated on \"Cells in Ellipse\" (right)")
Figure T4.22 Plot Ungated (left) become gated on "Cells in Ellipse" (right)
6.Move the ellipse gate. You will see the plot that is gated on "Cells in ellipse" update as the "Cells in ellipse" gate is moved.
7.Click on the plot that you have gated so that it is in edit mode. You will know it is in edit mode because there will be a green border around the plot.
The Current Gate field on the left side of the Create Gates group of the Gating tab will display "Cells in ellipse" (see Figure T4.23), indicating that the current plot is gated on "Cells in ellipse".
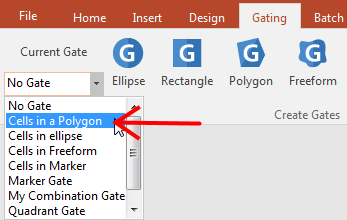
Figure T4.23 Selecting the "Cells in a Polygon" Gate
8. Click on the arrow next to "Cells in ellipse" to drop down the list of available gates.
9.Select the "Cells in a polygon" gate (Figure T4.23).
Your plot should only display cells that are in the "Cells in polygon" gate, as shown in Figure T4.24.
Note: The plot may not look exactly like Figure T4.22 because you may have placed your ellipse gate in a slightly different position.
 become gated on \"Cells in Polygon\" (right)")
Figure T4.24 Plot Gated on "Cells in Ellipse" (left) become gated on "Cells in Polygon" (right)
10. Select the View→Navigators→Gate Navigator command.
11. The Gate Navigator will appear (Figure T4.25). The Gate Navigator displays all the current gates and indicates which gates are being applied to a plot.
12. Move the Gate Navigator to the side of the layout in order to have a complete view of your plots.
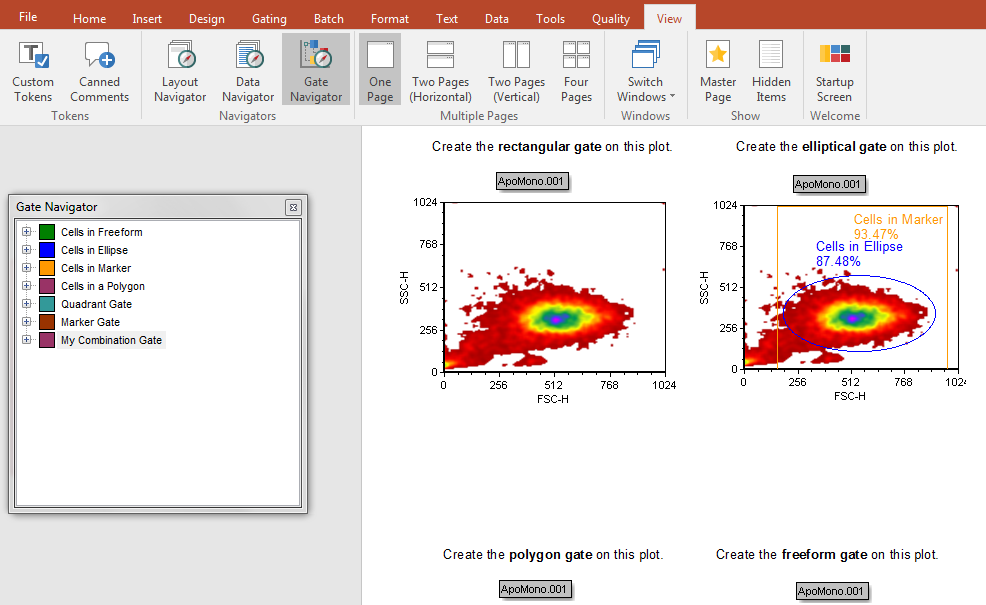
Figure T4.25 Opening the Gate Navigator Window
13. Drag and drop the "Cells in freeform" gate onto the 2D plot labeled "Create the rectangular gate on this plot". As soon as the mouse will be onto the plot, the latter will become blue highlighted (Figure T4.26)
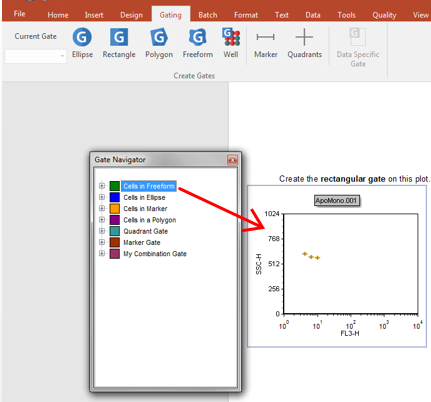
Figure T4.26 Drag&Drop a Gate from the Gate Navigator window onto a plot
14. Release the mouse button to apply the gate.
The "Cells in freeform" gate is now applied to the plot as indicated on the updated Gate Navigator (Figure T4.27).

Figure T4.27 Gate Navigator Updated
Note: you can also drag and drop a gate from the Gate View (Figure T4.13) onto any plot, exactly in the same way we did here from the Gate Navigator window.