Bar Plots
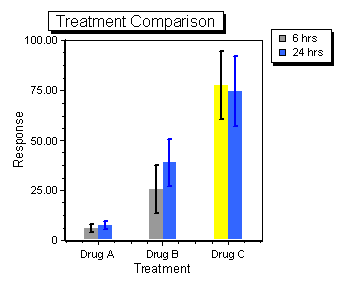
Bar Plots are a convenient visualization tool for comparing several statistics at a glance, whether these derive from different gates, plots, data files, ratios, or complex statistical formulae. Bar plots are unitless along the X-axis, being labeled with user-defined, nominal categories instead (e.g., Figure 11.30). Thus bar plots are not truly bivariate, unlike scatter plots.

Figure 11.30. Bar Plot in FCS Express
Bar Plots can be inserted anywhere on your layout, and can be populated from Spreadsheets or by dragging and dropping gates, plots, or statistical tokens. They are also fully formattable.
