Custom Grid Options
FCS Express allows for customization of output format when printing, creating PowerPoint documents, and generating PDF files, from the export and batch processing features by setting Custom Grid Options (Figure 4.1). These options allow you to export in a mode where multiple plots or pages are tiled in your resulting document automatically allowing for many plots or pages to be presented on one (or many) page(s) in your final report according to the tiling options you have defined. The Custom Grid Options may also be enabled when using the Multiple Duplicate and Next and Multiple Duplicate and Prev(ious) options available from the Home tab→Clipboard group→Duplicate dropdown menu. The selected plot(s) will be duplicated in a mode where the new plots will be added to same page or other pages of the layout based upon tiling options defined.

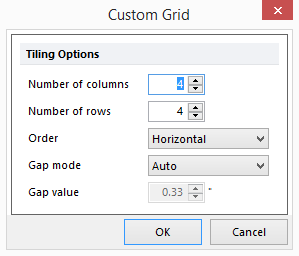
Figure 4.1 Custom Grid Options
When selecting Custom Grid Options, the Custom Grid popup window will appear, which will contain the following five settings:
•Number of columns: define the number of layout pages displayed across the printed page(s) or exported slide(s) or PDF page(s).
•Number of rows: define number of layout pages displayed down the printed page(s) or exported slide(s) or PDF page(s).
•Order: arrange the layout pages across (Horizontal) or down (Vertical) the printed page(s) or exported slide(s) or PDF page(s).
•Gap mode: select how to define horizontal distance (Gap value) between layout pages.
•Gap value: value used for distance of Gap mode in inches; will update automatically if Gap mode is set to Auto; will be 0.02 inches if Gap mode is set to Minimal; can enter preferred value if Gap mode is set to Manual.

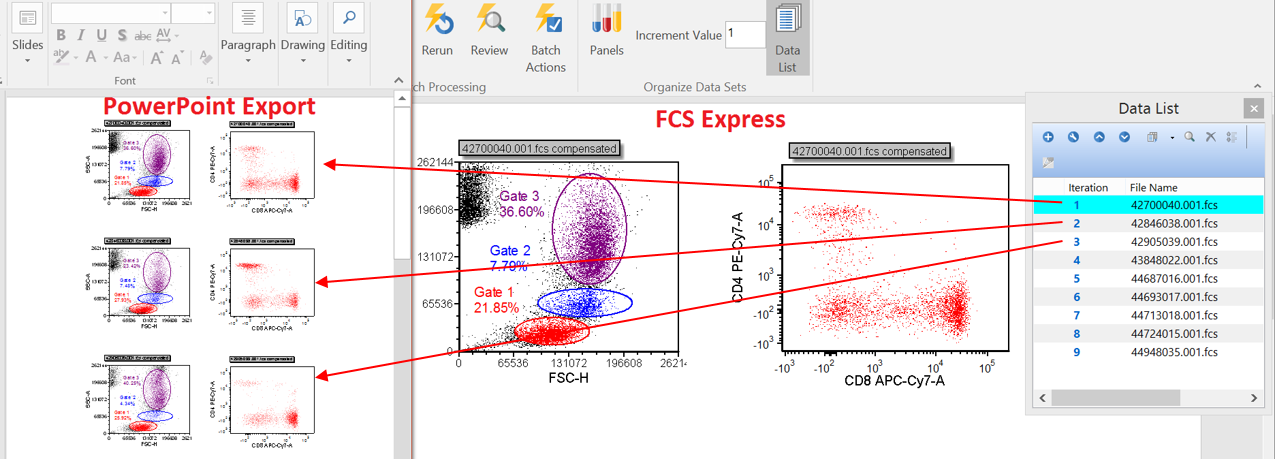
Example of batching a set of data files from the data list to PowerPoint using the Custom Grid feature. Notice that one set of plots was defined in FCS Express and a series of tiled plots have been exported to PowerPoint in one column in three rows.
