DNA Position Markers
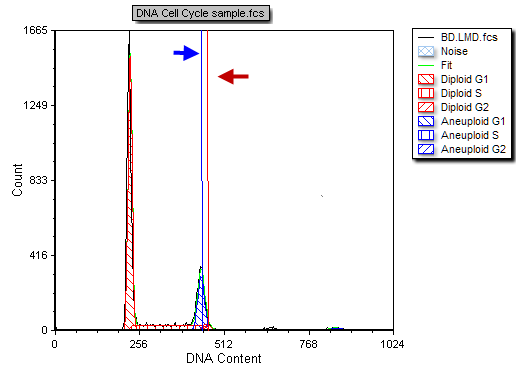
The position of cell cycle parameters (e.g., the G1 mean or the background regions) can be displayed with the use of DNA Position Markers (Figure 25.5).

Figure 25.5 DNA Histogram showing Diploid G2 Position Marker (Red) and Aneuploid G1 Position Marker (Blue)
You can show or hide a position marker by either:
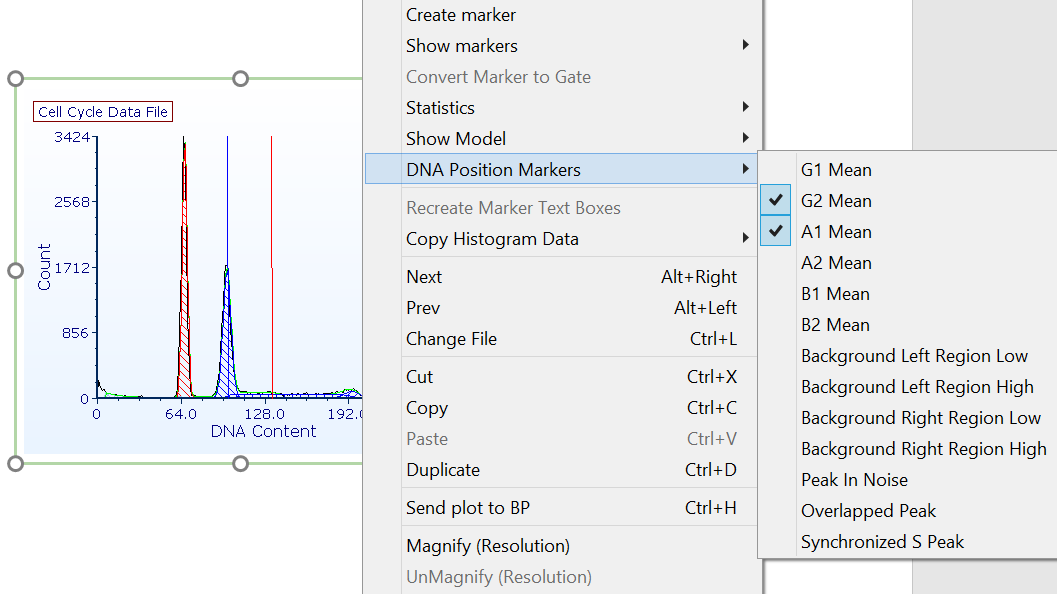
•Right-clicking on the DNA Histogram, selecting DNA Position Markers from the pop-up menu, and toggling the appropriate position marker on or off from the submenu (Figure 25.6), or
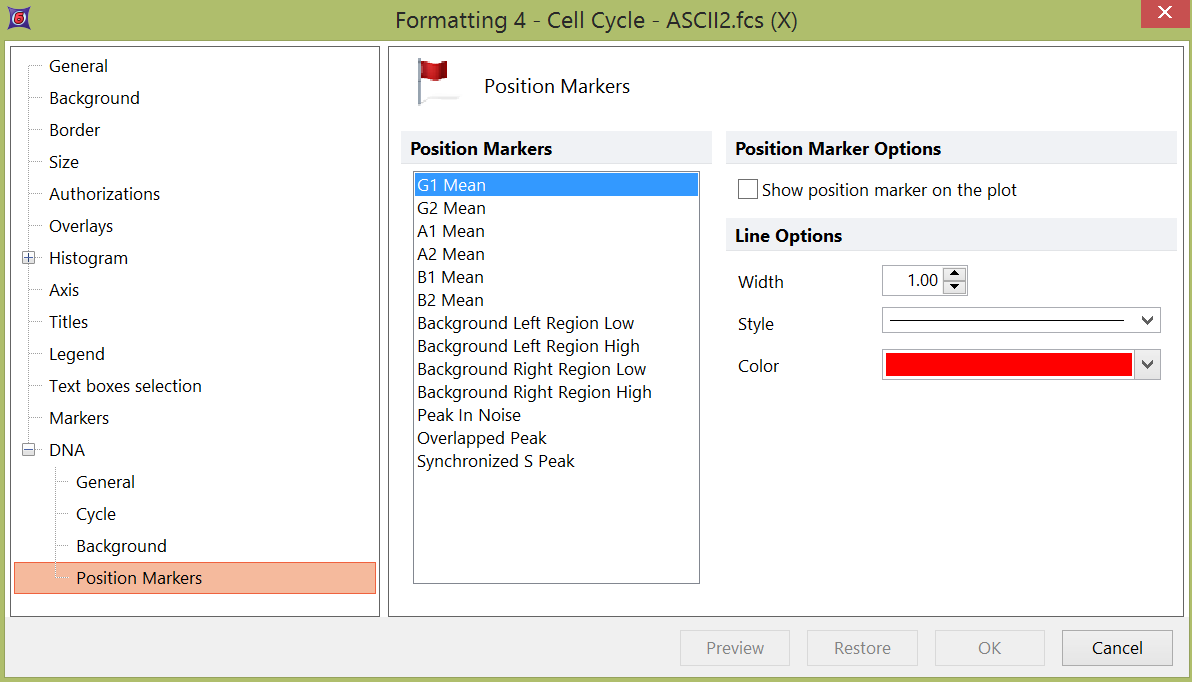
•Right-clicking on the histogram, selecting Format from the pop-up menu, expanding the DNA category node, and choose the Position Markers category

Figure 25.6 Showing or Hiding DNA Position Markers
To adjust the visibility, style, color, and/or width of a marker, right-click on the DNA Histogram, select Format from the pop-up menu, expand the DNA node, and choose the Position Markers category (Figure 25.7). Select the marker from the list on the left (use Ctrl+Click to select multiple markers). The Show position marker on the plot checkbox controls the visibility of the selected marker.

Figure 25.7 Formatting a DNA histogram - Position Markers
