Overlaying Items on a Page
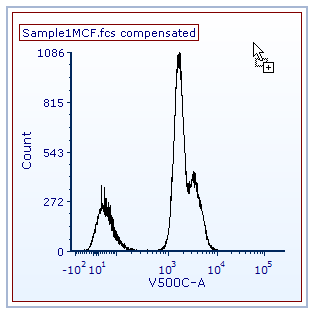
In addition to the edit and selected modes, FCS Express 6 introduces a third mode called overlay. When an object is in Overlay Mode, it is outlined in blue (Figure 4.37).

Figure 4.37 - Histogram in Overlay Mode
Dragging and dropping selected data file(s) from the Data List onto the following plots, will activate overlay mode and prompt the Select Drag and Drop Action window upon mouse release:
Histogram, Kinetics, Multicycle DNA, Proliferation, Scatter, Scatter with Regression, Bar Chart, Pie Chart, Dot, Color Dot, Heat Map
Dragging and dropping selected data file(s) from the Data List onto the following plots, will activate overlay mode and replace data upon mouse release:
2D Plots - Contour, Density, Surface
Dragging and dropping Gates, Markers, or Quadrants onto plots will activate overlay mode and be applied upon mouse release.
Dragging and dropping plots onto Text boxes will activate overlay mode and prompt Paste Special window to select Keyword or Statistic Token.
