The Histogram Subtraction Tool
Histogram subtraction allows you to determine the percent positive on a histogram by subtracting a negative control histogram from a sample histogram. Histogram subtraction can be
1. Set up to be automatically calculated and appear on the Histogram Statistic table. In this case, the Overton Subtraction method is used.
2. Performed on an individual basis using the Histogram Subtraction tool. In this case, the subtraction can be performed using different method.
To have the histogram subtraction automatically performed and displayed in a histogram statistics window:
•Make sure the percent positive column is visible for the statistics window.
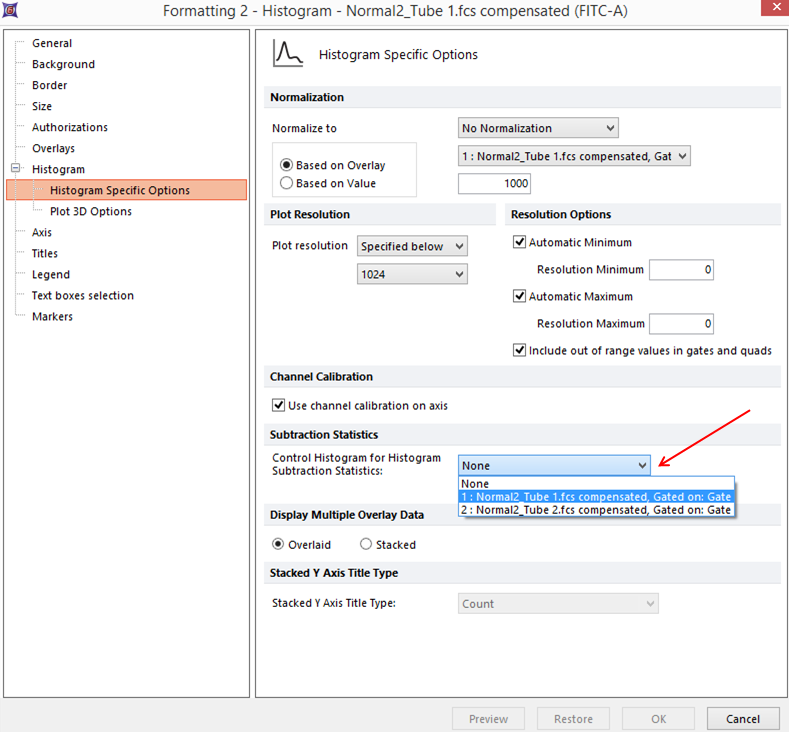
•Use the Format→Plot Options→Specific Options command (or right-click on the histogram, choose Format, and select the Histogram→Histogram Specific Options category). Set the Control Histogram for Histogram Subtraction Statistics field to the appropriate negative control (Figure 13.1). Statistics histogram subtraction always uses the Overton Subtraction method, described below.

Figure 13.1 Setting the Control Histogram in the Formatting Histogram Specific Options Dialog
To perform an individual histogram subtraction, select the Tools tab→Calculate category→click Histogram Subtraction command on the ribbon (Figure 13.2).

Figure 13. 2 - Histogram Subtraction command on ribbon
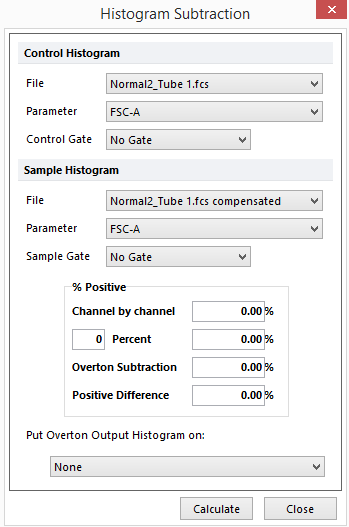
The Histogram Subtraction window (Figure 13.3).

Figure 13.3 Histogram Subtraction Window
A histogram subtraction can be performed for any FCS file that is currently open. Select the File, Parameter, and Control or Sample Gate for the Control Histogram and Sample Histogram in the appropriate places. Press the Calculate button to perform the histogram subtraction. The percent positive is calculated in four different ways, of which the Overton Subtraction and Positive Difference methods are usually the most accurate.
The methods used to calculate % Positive are:
•Channel by channel
The control histogram is subtracted from the sample histogram on a channel by channel basis. In other words, the number of cells in channel N of the control is subtracted from the number of events in channel N of the sample. All of the positive results (i.e., where there are more cells in the sample channel N than in the control channel N) are summed and are then divided by the total number of cells to yield a positive result.
•X Percent
In this method, you set a cutoff channel value at the top of the control population and consider all cells above this channel to be positive. To determine the cutoff value, enter a value in the edit field to the left of the Percent label. If you enter the value 2, the cutoff channel will be below the highest two percent of the control cells or the 98th percentile. Any cells in the sample histogram that are above this channel are considered positive.
•Overton Subtraction
This technique is similar to the channel by channel subtraction method except that negative differences (where the number of cells in control channel N is greater than the number of cells in sample channel N) are added to the positive differences in lower channels. After all channels have been analyzed, residual negative results are set to zero, and the sum of the positive results is divided by the total number of cells to yield a percent positive.
•Positive Difference
The percent of cells between channel N and channel N-1 are calculated for the sample and control histogram and the difference between these percentages is determined. This difference is determined as N moves from channel 1 to the last channel. The largest difference found becomes the percent positive.
The Overton Subtraction results in a histogram overlay that contains all the positive cells. This overlay can be placed on a histogram by choosing an existing histogram in the Put Overton Output Histogram On field. Statistics can be calculated on this overlay as if it were a regular overlay on the histogram.
