Inserting a Histogram

Contents
To demonstrate inserting a 1D plot in a custom size, we will add one to the layout made in the previous section.
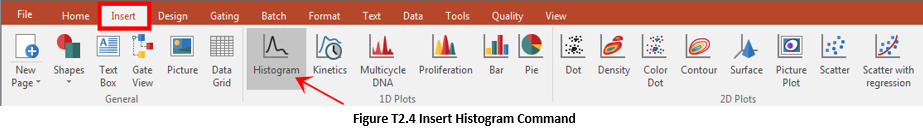
1.Select Insert→1D Plots→Histogram (Figure T2.4).
2.Move the mouse to a place on the layout where you would like the top left corner of the plot to be located.
3.Press and hold the left mouse button down.
4.Move the cursor, while holding the mouse button down, until the sizing rectangle is the size you want the histogram to be (Figure T2.5).
")
Figure T2.5 Insert Histogram (Step 4)
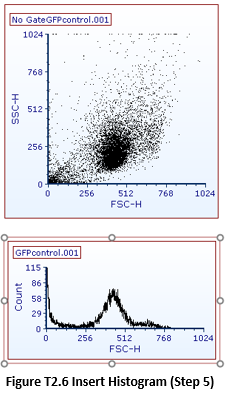
5.Release the mouse button and the histogram (shown with the red border) will be inserted in the place of the sized rectangle (Figure T2.6).
Note that when inserting the histogram, you were not prompted to select a file. This is because FCS Express uses the most recent data file when adding a new plot. You are only prompted to select a data file if no data files have been opened, or you select the When creating a new plot, always display the selection dialog preference from the FCS Express User Options (described below).
Plots can also be inserted using the Data→Save/Load→Open command.