Legend Options
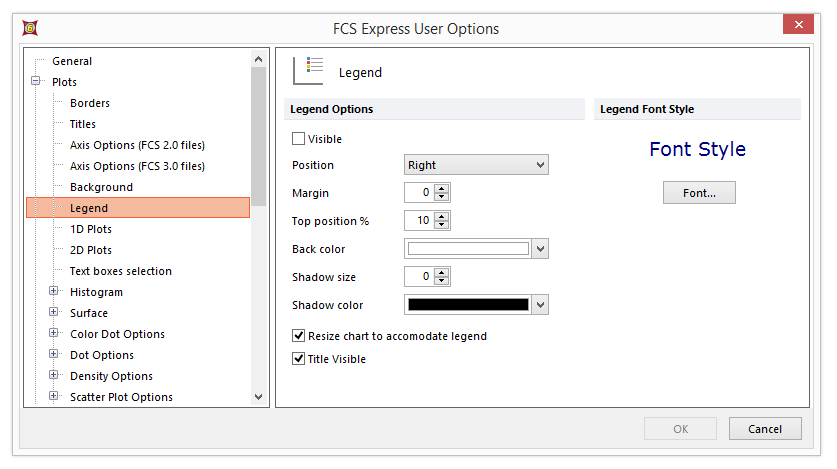
This category controls the default behavior and appearance of plot legends. The options are explained below and pictured in Figure 8.8.

Figure 8.8 Legend Options
Option |
Explanation |
|---|---|
Legend Options |
If Visible is checked, the legend will appear by default. If unchecked, it must be added via Formatting options on a per-plot basis. Position: This defines the position of the legend within the plot. Options are Left, Right, Top, Bottom. Margin: This defines how much space is available between the legend and the plotted data. Top Position: This defines the distance of the legend from the top of the plot. Back Color: This defines that color that is applied to the background of the legend. Shadow Size: This defines the degree to which a shadow is applied to a legend. A larger number applies a more intense shadow. A value of zero applies no shadow. Shadow Color: This defines the color of the shadow. Resize chart to accommodate legend: This defines whether or not the plotted area will resize itself to accommodate the size of the legend. Title Visible: Enabling the check box will display the legend title on Density and Contour plots. The legend title is text as well as an interactive drop down menu that allows you to easily change the parameter to use for the Color based on option. |
Legend Font Style |
Defines the default font of legend text. |
