More Complex Custom Token Examples
The following two examples demonstrate more complex custom token formulas:
•Custom Token Example 5 demonstrates the use of parentheses to control the order in which mathematical operations are applied. The part of the formula inside the parentheses is performed first. The Custom Token formula in Figure 19.41 calculates the average number of events across three plots.

Figure 19.41 Custom Token Example 5 Formula
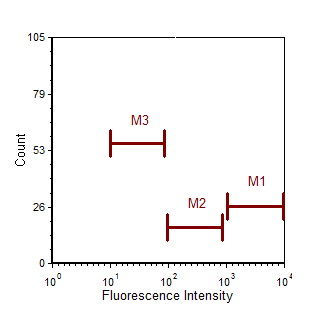
•Custom Token Example 6 demonstrates the use of nested IF..THEN..ELSE statements. The custom token formula shown in Figure 19.42 categorizes the fluorescence of a histogram based on the percentage of events within marker regions (Figure 19.43). If 80% of the events exist in the right marker region (M1), then the formula returns Bright. If the middle marker region (M2) contains 80% of the events, then Medium is returned. If 80% of the events exist in the left marker region (M3), then Dim is returned. If none of the markers contain more than 80% of the events, then Unknown is returned.

Figure 19.42 Custom Token Example 6 Formula

Figure 19.43 Fluorescence Intensity Marker Example
Additional conditions could be applied in Example 6. For example, if the sum of two markers contains more than 80% of the events, then Bimodal could be returned.
