Percentile Quadrants
FCS Express allows you to set quadrants according to percentages instead of manual positioning.
In the course of this example, we will:
•Learn how to set rectangular quadrants using percentiles.
For convenience, we are going to start with the same layout as before. If you have the previous layout still open, please jump to Step 3.
1.Select File tab→Open Layout.
2.Open the layout QuadTut.fey found in the Tutorial Sample Data archive.
3.Select the Gating→Create Gates→Quadrants command (Figure T6.1).
4.Click in the middle of the left density dot plot.
Two density dot plots now appear on the layout with quadrants appearing on the left plot.
To set a quadrant with percentages:
3.Click once on the left plot to select it.
4.Select the Format→2D Options→Quadrants command (Figure T6.5).
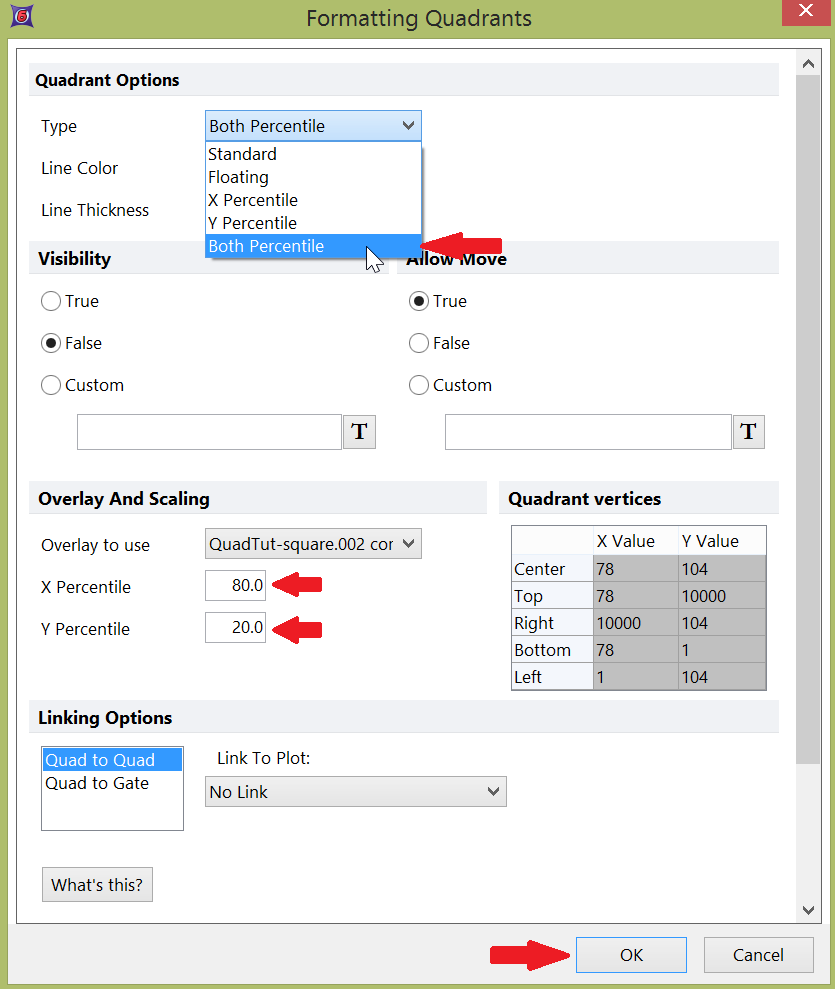
The Formatting Quadrants dialog will appear, similar to Figure T6.10.
5.Change the Type of the quadrants listed in the drop-down menu from Standard to Both Percentile, indicated by the cursor in Figure T6.10.
Notice that the X Percentile and Y Percentile options on the Formatting Quadrants dialog are now enabled (Figure T6.10).

Figure T6.10 Formatting Quadrants Dialog -- Setting Type to Both Percentile
6.Enter "80" in X Percentile field (Figure T6.10).
7.Enter "20" in the Y Percentile field (Figure T6.10).
8.Click OK.
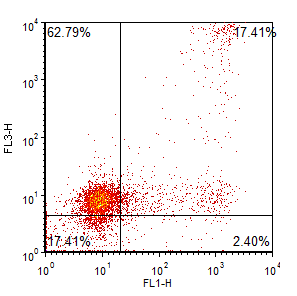
The quadrants have adjusted automatically and appear similar to Figure T6.11. The sum of the Upper Left and Lower Left quadrants is approximately 80% (± rounding errors), and the sum of the Upper Right and Lower Right quadrants is approximately 20% (± rounding errors).

Figure T6.11 Percentile Quadrants of 80% and 20%
We will now use the plot pop-up menu to format the quadrant and change the X and Y percentile values.
9. Right-click on the left plot to bring up the associated pop-up menu.
10.Select Format from the pop-up menu.
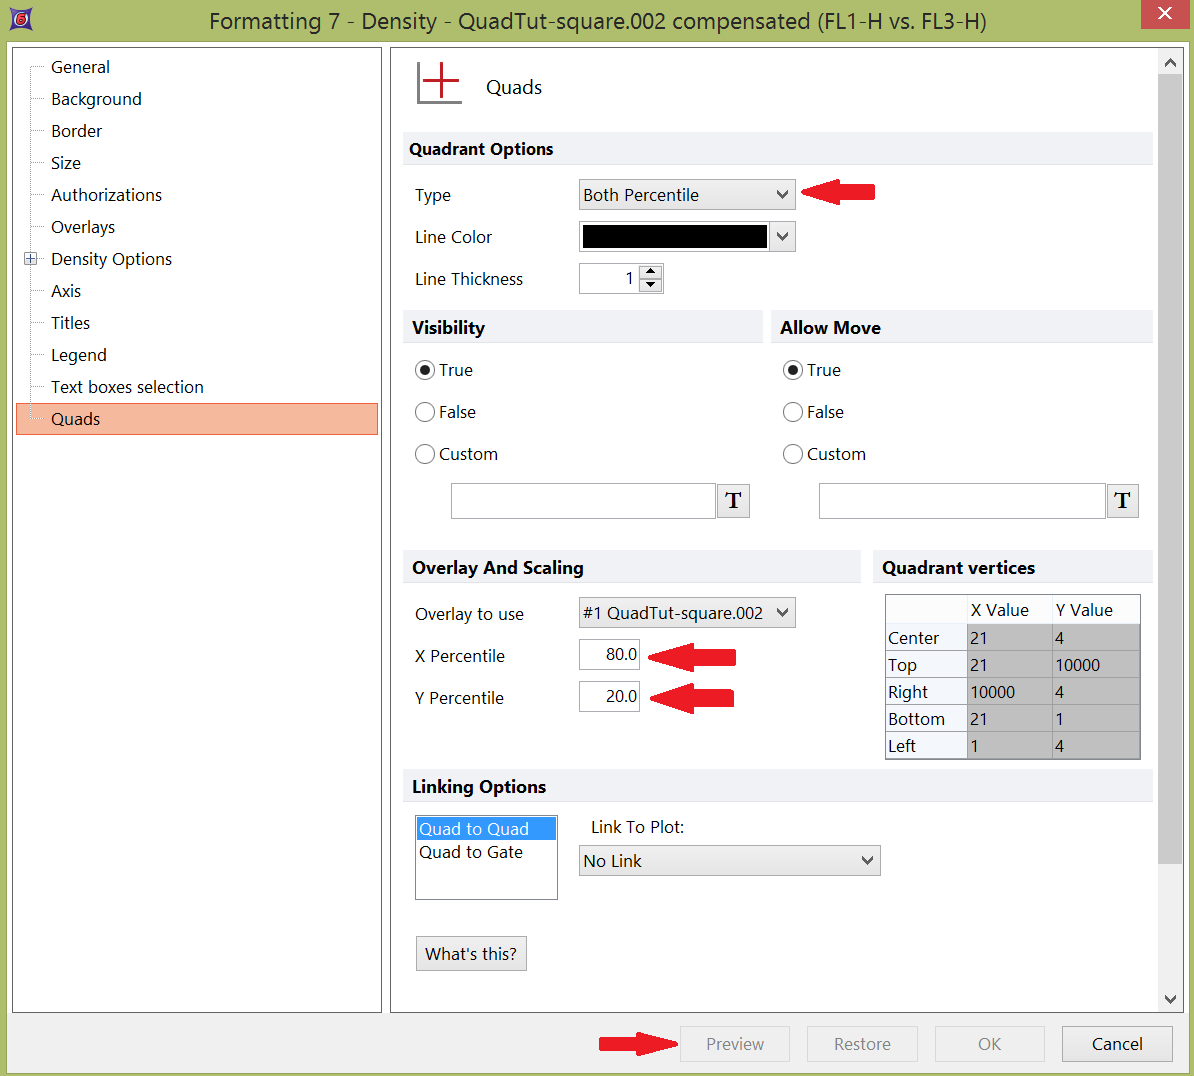
11.Select the Quads category from the left of the Formatting dialog (Figure T6.12).
12.Change the X and Y Percentiles to 82 and 8 respectively (Figure T6.12).
13.Click Preview, indicated by the cursor in Figure T6.12.
Using Preview allows you to quickly manipulate the percentiles until you reach your desired result.

Figure T6.12 Using Preview while Setting Percentile Quadrant Values
Percentile quadrants are very useful when you have a plot that has a control population. You can have the quadrants automatically adjust to ensure that a specific fraction of the cells are in the lower left quadrant. You can then link the quadrants on the control plot to the quadrants on the sample plots, and all of the quadrants will update appropriately.
