Plot Names
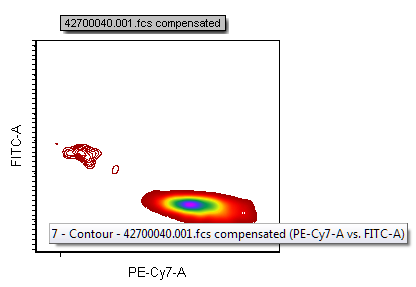
Plot names assigned by default include information about the plot type, .fcs file data, displayed parameters, and order of creation in your layout. Plot names appear in hovertext over the plot (Figure 8.83) and in navigators, and assist in selecting the data source when inserting a token on your layout or in setting up batch processing actions.

Figure 8.83 Default plot name as shown in plot hovertext.
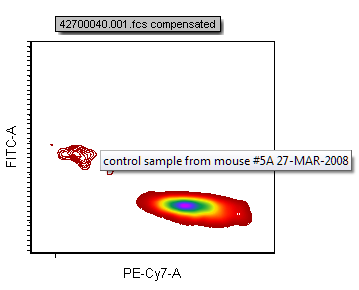
Plot names can be customized to contain free text, tokens, or a combination thereof. The same plot's hover text is shown below in Figure 8.84 after being changed to a combination of freetext and the $DATE keyword token.

Fig. 8.84 Plot name changed to contain freetext and a keyword token.
To customize the plot name, either:
•Select the plot, use the Format→Object Options→General command, and edit the Plot Name, or
•Right-click on the plot, select Format from the pop-up menu, choose the General category, and edit the Plot name.
•The Data, Layout, or Gate Navigator may also be used to change the Plot name by right clicking on the plot within the navigator and choosing Rename.
•Alternatively, a Suffix for Compensated Data may be added or removed from the FCS Express User Options→General→Suffix for Compensated Data Category.
