Setting Up Compensation Definitions
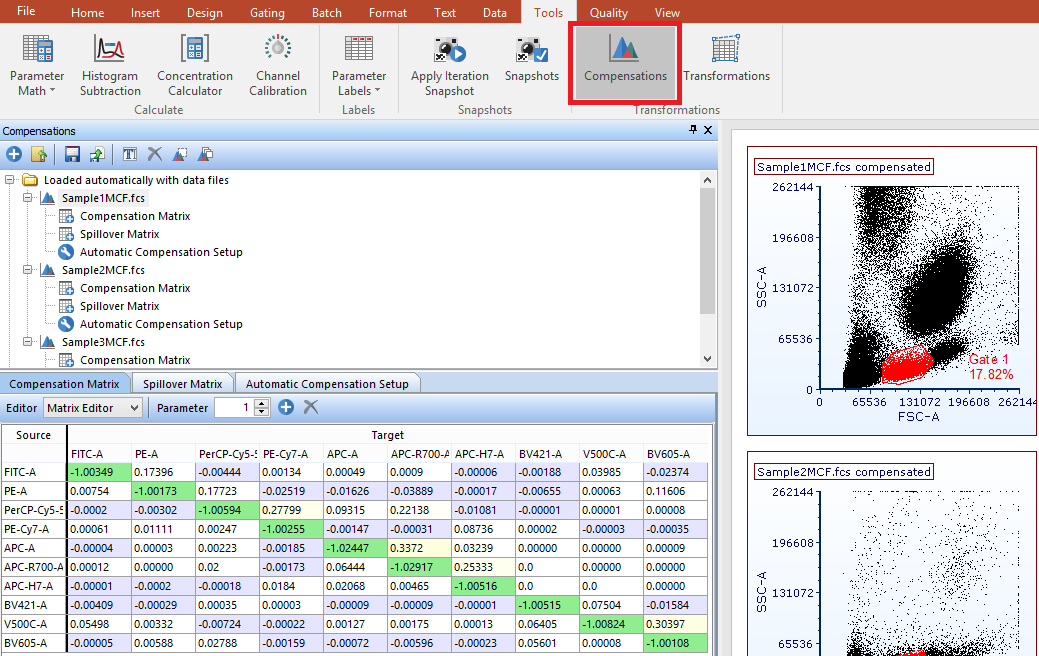
In order to view all the current compensation definitions in the layout, select the Tools tab→Transformations→Compensations command. A dockable window titled Compensations will open. The Compensations window will list all of the compensation definitions that are available in the layout within the Loaded automatically with data files or the Created manually folders. (Figure 16.1). The Loaded automatically with data files folder shows compensation definitions that were automatically loaded with a data file presently showing on the layout (e.g., one defined during acquisition and saved as metadata with a modern FCS 3.0 or greater format .fcs data file) and the Created manually folder shows compensation definitions that have been created manually within FCS Express.

Figure 16.1 Compensations Navigator showing compensations available in the layout.
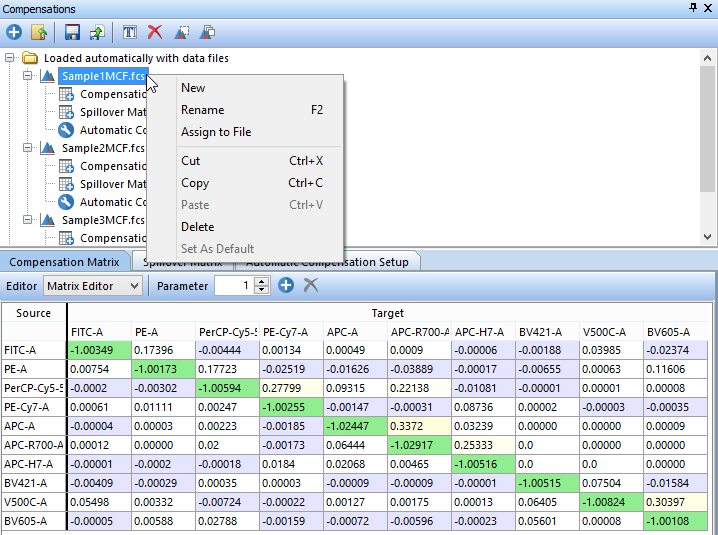
The Compensations window (Figure 16.2) is dockable and pinnable like many other windows in FCS Express. There are many actions you can perform from the Compensations window tool bar. You can perform the action either by pressing the appropriate button (hover the mouse over the button for tooltip) or by right-clicking on a compensation folder or sub-item. The actions are summarized in the table below:

Figure 16.2 Compensations Navigator showing available commands and actions.
Action |
Command |
Explanation |
Create a new compensation |
|
Add a new compensation definition. |
Import a compensation from a file |
|
Import a previously saved compensation (*.compensation) file. |
Export the selected compensation |
|
Export a compensation (*.compensation) file for use in other layouts. |
Assign this compensation to a data file |
|
Assign a compensation definition to a file or series of files. |
Rename the selected compensation |
|
Renames the selected compensation definition. |
Delete |
|
Deletes a compensation definition from the compensation window and the plots to which it was applied. |
Cut Object |
Right-click on compensation→Cut Object |
Performs a cut command on the compensation definition. If performed on the Compensation or Spillover Matrix, the Matrix can be pasted into a Text Box or other document. |
Copy Object |
Right-click on compensation→Copy Object |
Performs a copy command on the compensation definition. If performed on the Compensation or Spillover Matrix, the Matrix can be pasted into a Text Box or other document. |
Set as Default |
Right-click on compensation→Set as Default |
Sets the selected compensation definition as the default compensation. The default compensation is the one that will be used when adding new plots. Only Created manually compensation definitions may be Set as Default; however, compensation definitions Loaded automatically with data files may be copied into the Created manually category for this purpose. |
The Compensations window also has tabs devoted to the Compensation Matrix, Spillover Matrix, and Automatic Compensation Setup (Figure 16.3). The Compensation Matrix and Spillover Matrix tabs allow you to view and Edit a Compensation Definition by utilizing the compensation or spillover matrix. You can choose to view the Matrix Editor or List Editor from the Editor drop-down (Figure 18 below) to view a matrix of Source vs. Target (Figure 16 below and left) or to view a list of Target - % Source (Figure 16 below and right). Please see the Automatic Compensation Setup section for details on this tab.

Figure 16.3 Compensations Navigator showing available tabs. Matrix Editor View (left) and List Editor View (right).
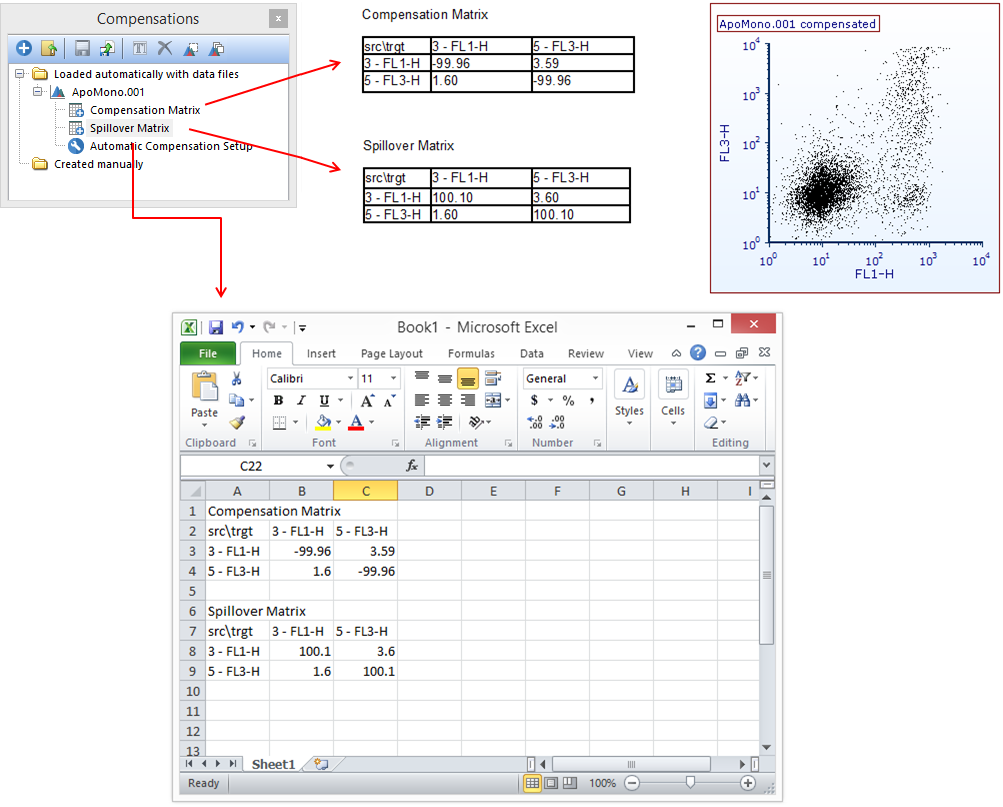
Once a Compensation or Spillover Matrix is defined, you can drag and drop either matrix directly onto a layout, into a text box, or even directly into Microsoft Excel to display the raw matrix data (Figure 16.4).

Figure 16.4- Drag and drop a compensation matrix from the Compensations navigator onto a layout, into a text box, or directly into Microsoft Excel to display the values.
