Showing the Concentration as a Token
In the course of this example, we will:
•Show the concentration as a token.
You can use FCS Express tokens to insert statistics in a text box to present your results. For more information, see the tutorial on using text boxes and tokens. In case you haven’t setup the concentration calculation, please do so now in the previous section of this tutorial.
1.Create a blank text box on the layout.
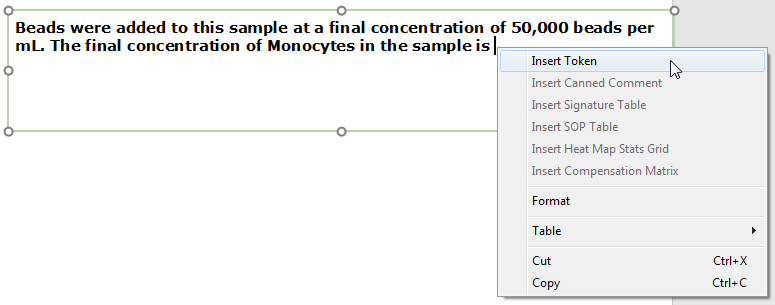
2.Enter the following text: "Beads were added to this sample at a final concentration of 50,000 beads per mL. The final concentration of Monocytes in the sample is <blank space>." in the text box.
3.Right-click on the blank space you left in the text box to bring up the associated pop-up menu (Figure T22.14).
4.Select Insert Token from the pop-up menu (Figure T22.14).

Figure T22.14 Inserting a Token in a Text Box
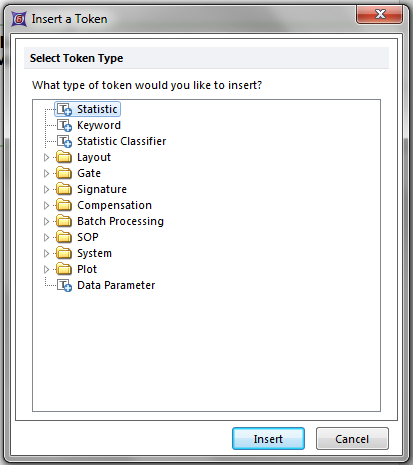
The Insert a Token dialog now appears (Figure T22.15).
5.Select Statistic from the Insert a Token dialog.
6.Click Insert (Figure T22.15).

Figure T22.15 Insert a Token Dialog
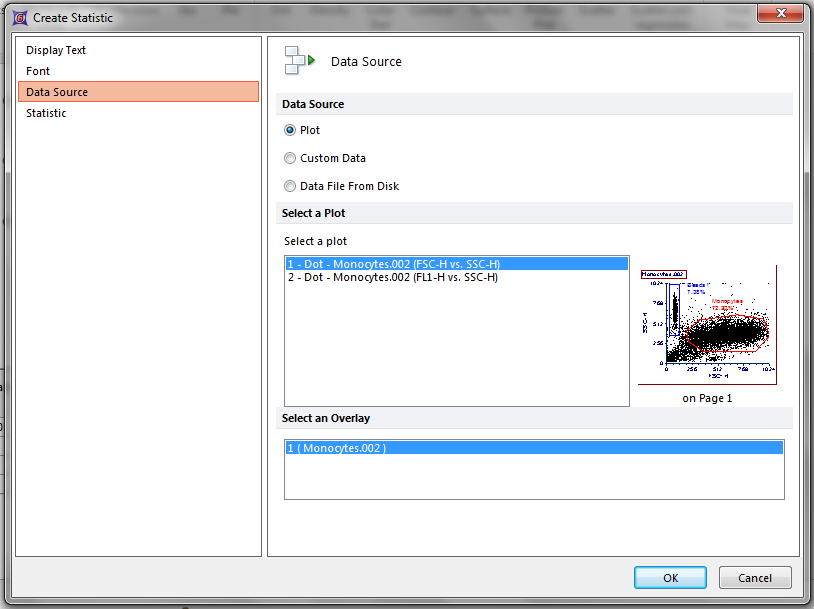
The Create Statistic dialog now appears with the Data Source category displayed (Figure T22.16). This is where you choose which plot the token will refer to; that is, which plot’s data will be used for the concentration calculation. If the plot contains multiple overlays, you can also pick the specific overlay you want to use for the calculation. Since we have created a very simple layout during this tutorial, there is nothing to change on this dialog.

Figure T22.16 Create Statistic Dialog -- Data Source
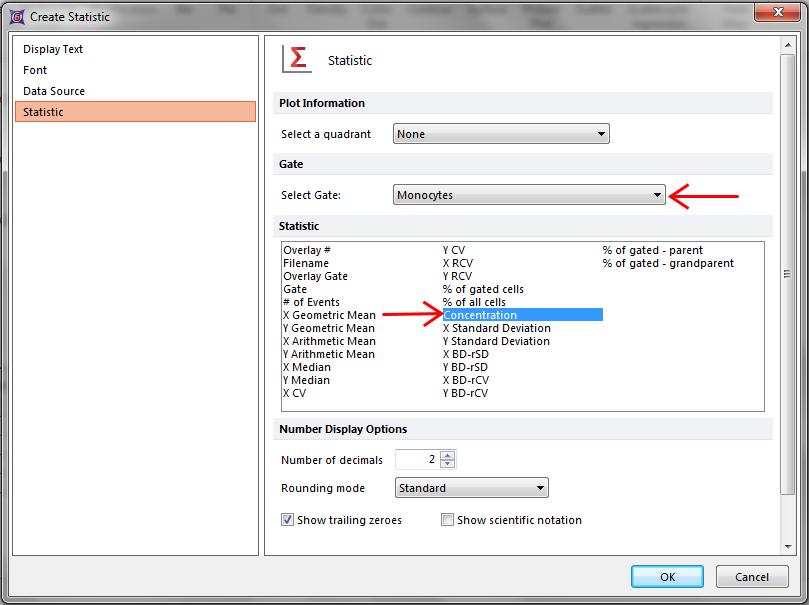
7. Click on the Statistic category in the left panel (Figure T22.17).
8. Select Monocytes from the Gate drop-down list.
9. Select Concentration from the Statistic list.
10. Click OK (Figure T22.17).

Figure T22.17 Selecting Concentration as the Statistic Token
The text box is now updated with the concentration of the monocytes using the token we just defined, shown highlighted in grey in Figure T22.18.
Figure T22.18 Text Box with the Concentration Token Value
You can now appreciate that the number in the token is the same as the number that appears in the statistic window for the "Monocytes" gate. What you have done is specify the four parameters needed for calculating the cell concentration, in two separate places: the volume was determined in the Stats Window Setup of the Concentration Calculator, and the number of cells was determined in the token setup itself.
