Using the Z-Prime Function
In high-throughput screens, experimenters often compare a large number (hundreds of thousands to tens of millions) of single measurements of unknown samples to positive and negative control samples. Large screens are expensive in time and resources. Therefore, prior to starting a large screen, smaller test (or pilot) screens are used to assess the quality of an assay, in an attempt to predict if it would be useful in a high-throughput setting. The Z-factor is an attempt to quantify the suitability of a particular assay for use in a full-scale, high-throughput screen.
FCS Express now provides a Z-Prime function for use in Custom tokens to make calculating the Z-Factor easy.
We will be using the HighContent_CalculatingZPrime.fey layout which is embedded with positive and negative control .fcs files. We will be utilizing tokens and custom tokens in this section. For a more detailed explanation of tokens, please view the Using Text Boxes and Tokens tutorial.
1.Open the HighContent_CalculatingZPrime.fey layout located in the FCS Express Sample Data directory.
The layout will look like Figure T18.35. It contains a negative control file on the left and a positive control file on the right. There is also a text box where we will place the formula for the Z-Factor and a classification.
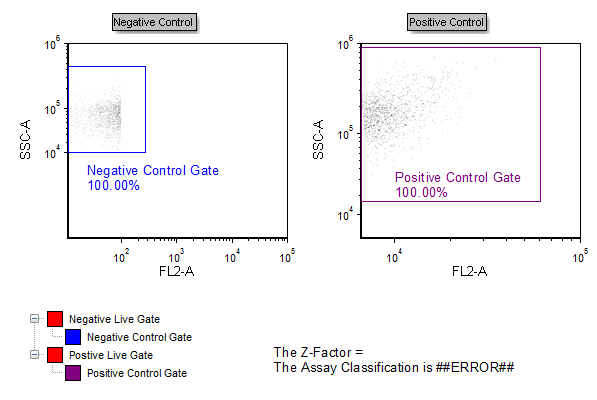
Figure T18.35 High Content Calculating Z-Prime Layout
2.Click the ![]() symbol in the Custom Tokens window.
symbol in the Custom Tokens window.
3.Name the new custom token "Z Factor".
4.Click in the Enter the Custom Token formula below field.
5.Enter an equals sign ("=").
6.Right-click after the equals sign.
7.Choose Insert Function→Statistics from the pop-up menu.
8.Choose ZPrime([mean negative, SD negative, mean positive, sd positive]) from the Statistics list (Figure T18.36).
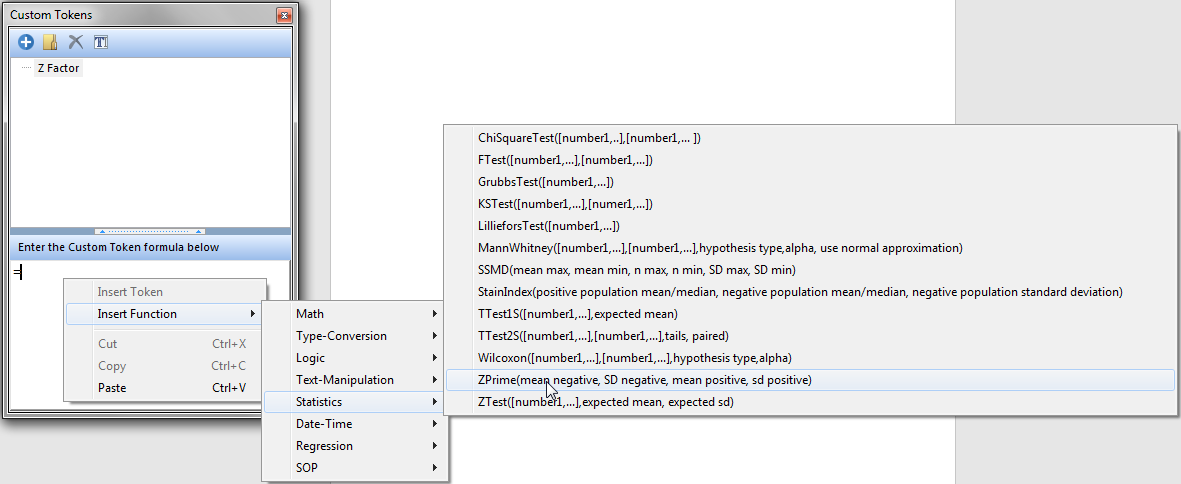
Figure T18.36 Choosing the ZPrime function from the Functions List
9. Highlight mean negative in the formula field (Figure T18.36b).
10. Right-click with the text highlighted and choose Insert Token (Figure T18.36b).
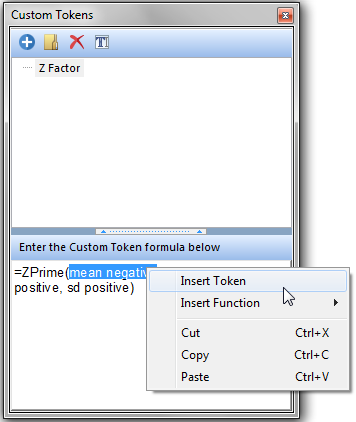
Figure T18.36b - Insert Token option
11. Double-click on Statistic. The Create Statistics window appears (Figure T18.36c).
12. In the Data Source section choose the Negative Control plot as the data source (Figure T18.36c).
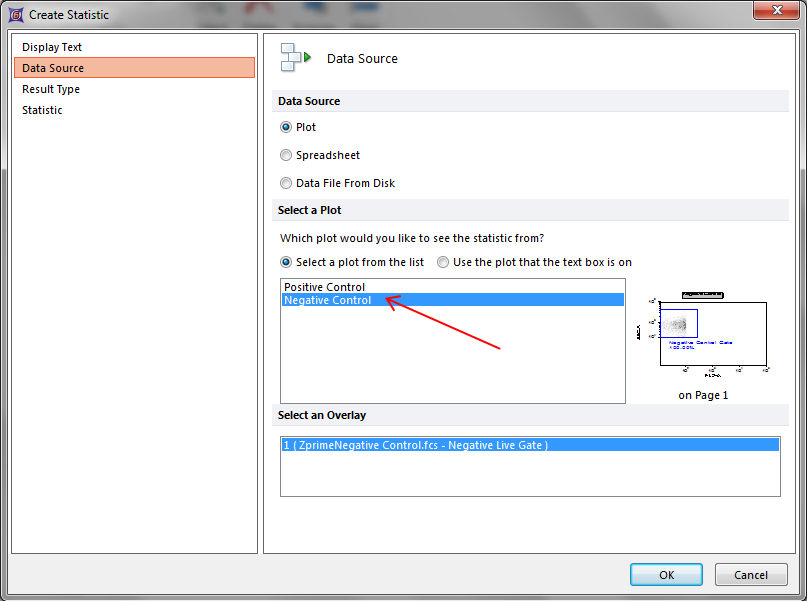
Figure T18.36c - The Create Satistics windows
13. Click on Statistic on the left.
14. Choose Negative Control Gate in the Gate section and X Arithmetic Mean from the Statistic section (Figure T18.37).
15. Click OK.
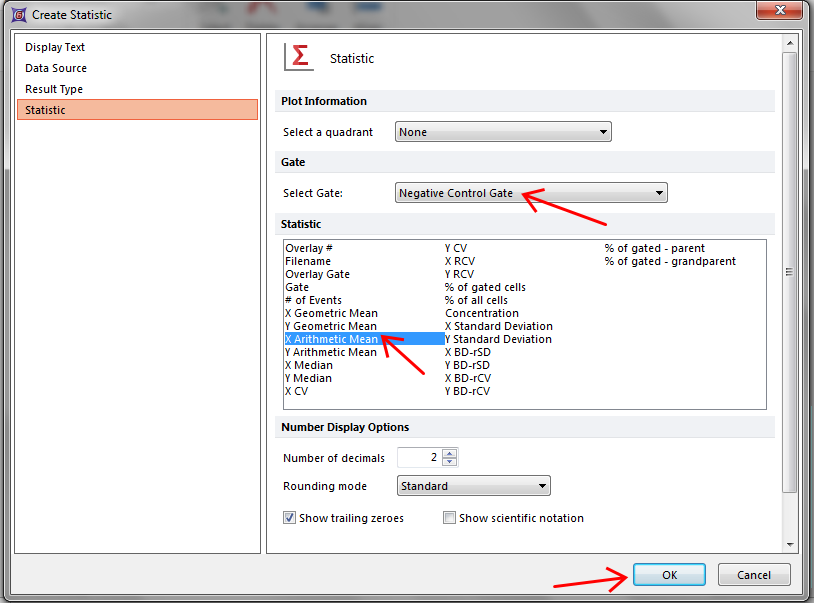
Figure T18.37 Replacing Text in a function with a Token
16. Highlight SD negative in the formula field.
17. Right-click with the text highlighted and choose Insert Token.
18. Double-click on Statistic.
19. Choose the Negative Control plot as the data source.
20. Click on Statistic on the left.
21. Choose the Negative Control Gate from the drop-down gate list
22. Choose X Standard Deviation from the Statistic list box.
23. Click OK.
24. Repeat steps 11-25 with "mean positive" and "SD positive" using the Positive Control plot as Data Source and the Positive Control Gate as gate.
The formula for the Z Factor custom token will now look like Figure T18.38 where each of the original text placeholders have been replaced with the representative token value.
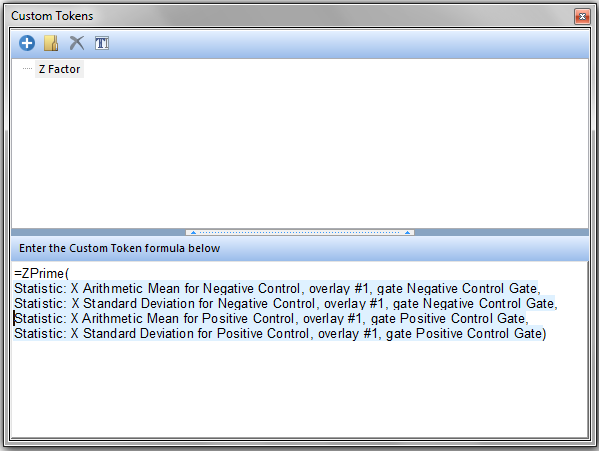
Figure T18.38 Z Factor Represented by the Z-Prime Function in FCS Express
25. Right-click after "The Z-Factor =" in the text box on the layout.
26. Choose Insert Token from the pop-up menu.
27. Double-click on Z Factor under Custom.
The Z-Factor custom token will now appear in the text box with a value of 0.00.
To interpret the Z-factor , we will use the guidelines from Zhang JH, Chung TD, Oldenburg KR, A Simple Statistical Parameter for Use in Evaluation and Validation of High Throughput Screening Assays. J Biomol Screen. 1999;4(2):67-73.
•A Z-factor of 1, ideal. Z-factors can never be greater than 1.0.
•A Z-factor between 0.5 and 1.0 is an excellent assay.
•A Z-factor between 0 and 0.5 is marginal.
•A Z-factor less than 0 means that the signal from the positive and negative controls could overlap, making the assay not very useful or screening purposes.
A Custom Classification Token has already been defined on this layout to classify the Z-Factor. To enable the classification token:
28. Right-click on ##ERROR## next to "The Assay Classification is".
29. Choose Format Token from the pop-up menu. The Edit Statistic Classifier window appears.
30. Choose the Classification category.
31. Click on the ![]() symbol in the Enter a value to classify field.
symbol in the Enter a value to classify field.
32. Double-click on Z Factor under Custom.
The Edit Statistic Classifier dialog should look like Figure T18.39.
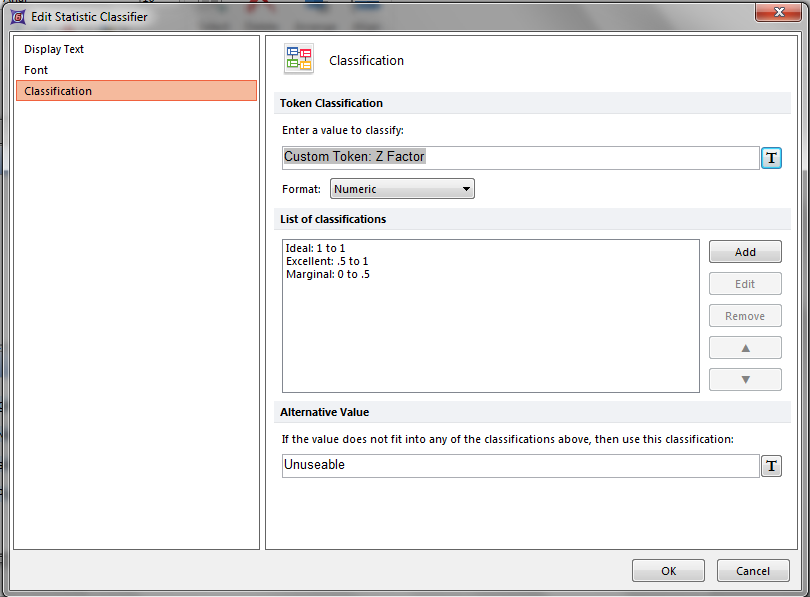
Figure T18.39 Changing the Classification Token to Z Factor
33. Click OK.
The layout will look like Figure T18.39b. The Assay Classification will read Marginal since the value is 0.00.
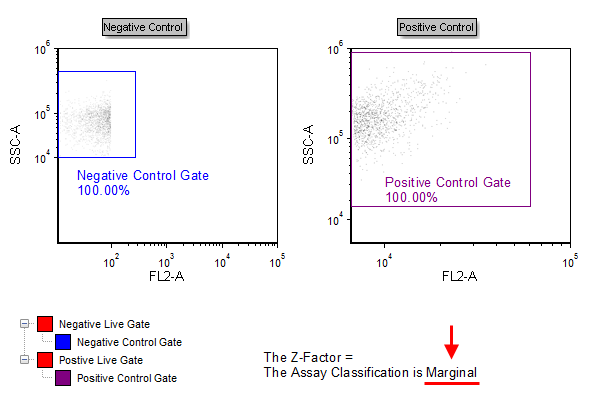
Figure T18.39b - The High Content Calculating Z-Prime Layout with the Classification Token
Adjusting the Positive Control gate to contain different portions of the sample will cause the Z Factor and Assay Classification to update in real time (Figure T18.40).
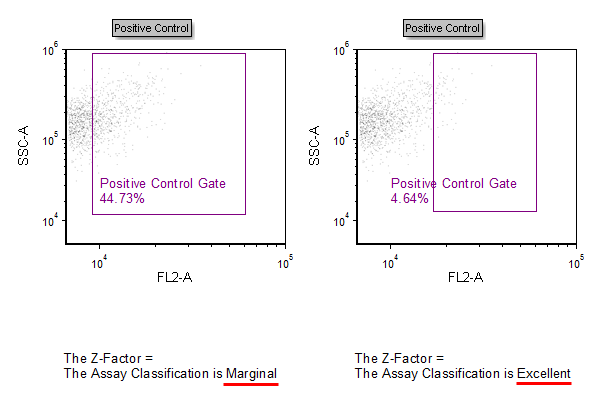
Figure T18.40 Gating on the Sample Data Causes the Z Factor and Classification to Update in Real Time
