Viewing Compensated and Transformed Values in Data Grids
Data grids may be formatted to display compensated and transformed values. Please note only one compensation and one transformation may be applied at a time for each plot or data grid selected. Also, the transformation will have its own column(s) displayed in the data grid, the number of which are dependent upon the transformation selected.
Compensations may be applied to data grids by any of the following commands:
•Drag and drop compensation from Compensations navigator (Figure 18.7).
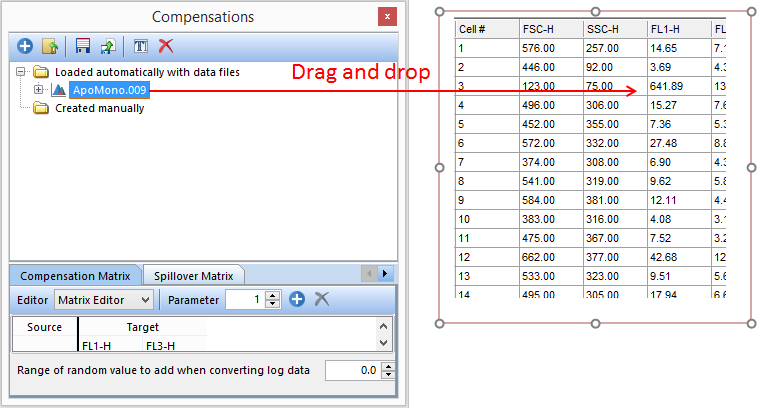
Figure 18.7 - Drag compensation from Compensations navigator and drop onto data grid (red arrow).
•Right-click data grid→Show Compensated Values→selecting None or one of listed options (Figure 18.8).
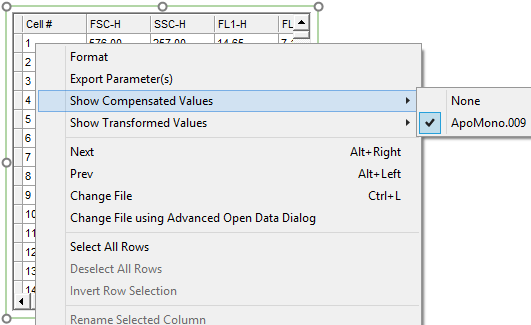
Figure 18.8 - Right-click data grid to Show Compensated Values menu.
•Access Formatting dialog for general options→Data Options→select compensation to use from Use Compensation drop down list→OK (Figure 18.9).
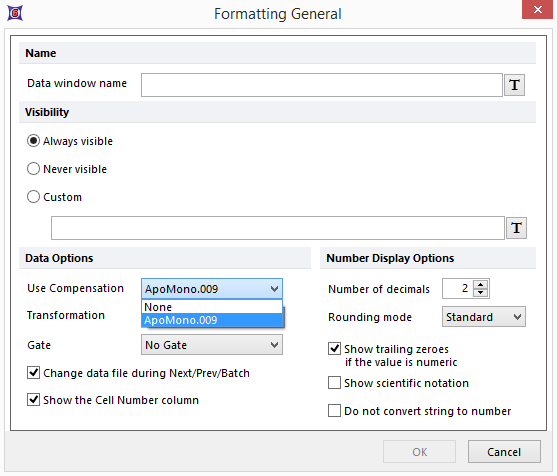
Figure 18.9 - Using Formatting dialog to select from Use Compensation drop down list under Data Options.
Transformations may be applied to data grids by any of the following methods:
•Drag and drop from the Transformations navigator to the intended data grid (Figure 18.10).
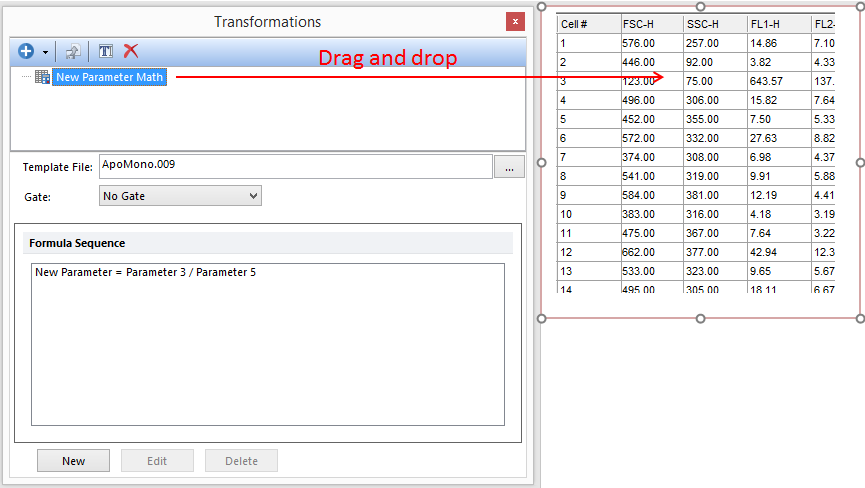
Figure 18.10 - Applying parameter math transformation to a plot by dragging from the Transformations navigator to the data grid (red arrow).
•Right-click data grid→Show Transformed Values→select appropriate transformation from menu.(Figure 18.11).
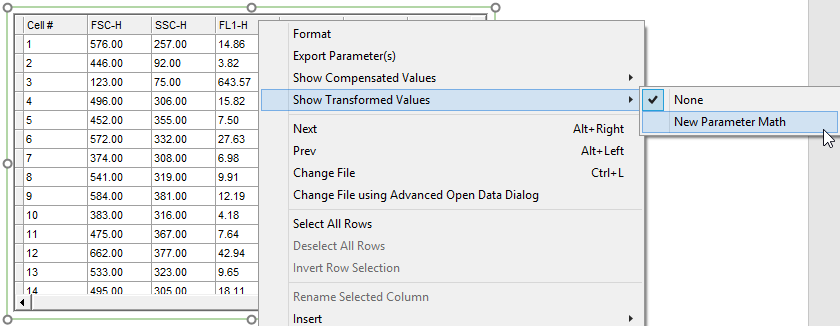
Figure 18.11 - Accessing parameter math transformation by right-clicking data grid and navigating to Show Transformed Values menu.
•Access Formatting dialog for general options→Data Options→select parameter math to use from Transformation drop down list→OK. (Figure 18.12).
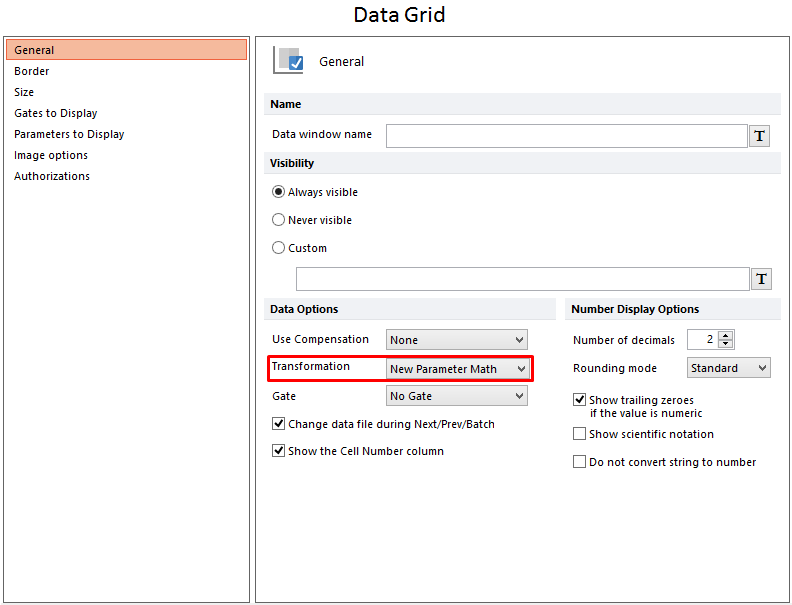
Figure 18.12 - Applying parameter math transformation to a data grid by selecting the parameter math in the Transformation drop down from the Formatting Overlays dialog.
