Apply Regression to an FCS File
We will use the linear regression formula calculated in the previous section to calculate MESF data for four unknown samples (i.e. four FCS files). The goal of this analysis is to assess the amount of IgG present in the patient's serum that is binding to the B- and T-cells of the potential donor.
The layout we will be using contains five pages. The first page displays the linear regression calculated in the previous section using beads. Page 2 and 3 define the negative and positive controls along with the patient sample. The MESF Calculations page is where we will be working to complete the linear regression and MESF data. The Bar Plots page will be used to easily visualize the data once it is complete.
1.Open the HLA CrossMatch.fey layout from the Calculating MESF From Regression subfolder in the Tutorial Sample Data archive.
2.Click on the MESF Calculations page tab of the layout.
This page contains two spreadsheets (Table 1 and Table 2), one for calculating MESF for B cells and one for calculating MESF for T cells. Each spreadsheet contain the "m" and "b" regression parameters calculated on Page 1 (Figure T18.18). This way, both parameter will be available in each spreadsheet using cell reference. Moreover, since they have been inserted as statistic tokens, they will automatically update if the linear regression change.
Note: as we will see in the Save a Regression section of this tutorial, linear regression parameters can be added to the data files as a keyword. This allows to use the regression parameter even in a brand new layout.

Figure T18.18 Inserting Linear Regression Fit Parameters - b and m - into Spreadsheet
Spreadsheets on MESF Calculations page also contain the Name, the Median fluorescence intensity and the log10-transformed Median fluorescence intensity of each of the four sample.
To calculate the MESF for the said unknown samples using the linear regression model previously calculated we will need to:
•Use the log10-transformed Median intensity (i.e. the X variable of the linear regression) to calculate the log10MESF value (i.e. the Y variable of the linear regression) following the linear regression formula Y=mX+b;
•Elevate the log10MESF value to the tenth in order to calculate the actual MESF value.
3.Select the G2 cell of Table 1 (i.e. the first available cell of the B Cell Log MESF column).
4.Type "=$B$2*F2+$B$3" (without quotes), where $B$2 is an absolute cell reference for the "m" parameter, F2 is a relative cell reference for the "X" parameter and $B$3 is an absolute reference for the "b" parameter.
Note: A cell reference can also be inserted in the formula by mouse selection for the cell of interest. Please see the referencing cells in a spreadsheet section of the manual.
5.Press Return on your keyboard. The formula is calculated in real time and the spreadsheet resembles Figure T18.19.

Figure T18.19 Calculating MESF Value for PBS Negative Control
Note: if you double click on cell G2, cell references will highlight as displayed in Figure T18.20.

Figure T18.20 Formula Used to Calculate MESF Value for PBS Negative
6.Select the H2 cell of Table 1 (i.e. the first available cell of the B Cell MESF column).
7.Type "=10^G2" (without quotes), where G2 is the relative reference to the B Cell Log MESF of the PBS NEGATIVE CONTROL SAMPLE.
8.Press Return on your keyboard. The formula is calculated in real time.
We will now fill the remaining cells of column G and H by copy-pasting the content of cells G2 and H2.
9.Multiple-select both cells G2 and H2.
10.Press Ctrl+C on your keyboard or, alternatively, right click and select Copy from the right-click menu.
11.Multiple select cells from G3 to H5 as shown in Figure T18.21.

Figure T18.21 Selecting Cells G3 - H5
12. Press Ctrl+V on your keyboard or, alternatively, right click and select Paste from the right-click menu. The cell are filled with the corresponding value and the spreadsheet looks like the one displayed in Figure T18.22.

Figure T18.22 B Cell Table Complete
We will now fill the T Cell Log MESF and the T Cell MESF columns of Table 2 by copy/pasting the content of the content of the B Cell Log MESF and the B Cell MESF columns respectively from Table 1.
13. Multiple-select cells from G2 to H5 as shown in Table 1 (i.e. the B cell Table).
14. Select the G2 cell in Table 2 (i.e. the T Cell table).
15. Press Ctrl+V on your keyboard or, alternatively, right click and select Paste from the right-click menu.
Table 2 is now completed and looks like Figure T18.23.

Figure T18.23 T Cell Table Complete
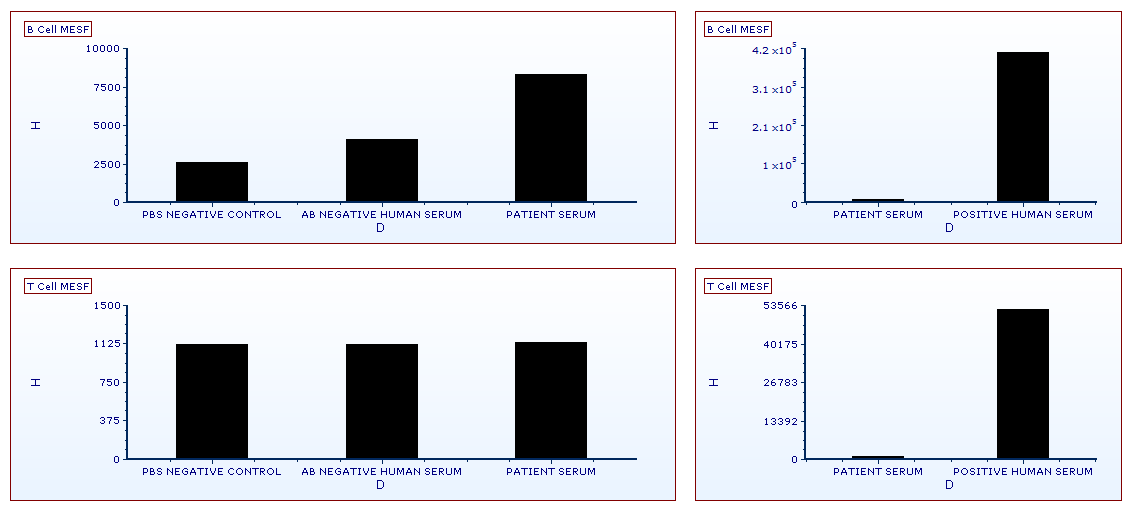
To see the results of the table expressed in a bar plot (Figure T18.24), please click on the Bar Plots page tab (for instructions on creating bar plots, please visit the Bar and Scatter Plots tutorial). You will see that the B-Cell MESF values for the Patient Serum are slightly elevated over negative controls yet well below the positive control. The T-Cell MESF values for the Patient Serum fall within the negative control range and are also well below the positive control value.

Figure T18.24 Bar Plots Displaying the FITC MESF HLA Cross Match Data from B- and T-cells
Next, we will save a previously created regression for use in another layout.
